Titan Company Elliott Wave technical analysis [Video]
![Titan Company Elliott Wave technical analysis [Video]](https://editorial.fxstreet.com/images/TechnicalAnalysis/ChartPatterns/PointFigure/hand-of-business-man-write-a-business-graph-59591884_XtraLarge.jpg)
Titan Elliott Wave technical analysis
Function: Counter Trend (Intermediate Degree, Orange).
Mode: Corrective.
Structure: Impulse within larger degree Corrective Wave.
Position: Minor Wave 2 Grey.
Details: The stock might have carved a top around 3920 earlier. Furthermore, an impulse drop is seen to complete just above 3000 mark followed by a corrective rally through 3780-3870. The stock has now turned lower as Minor Wave 3 Grey unfolds against 3920. Alternative counts are marked on the chart, which shall be discussed if price action behaves accordingly.
Invalidation point: 3910-20.
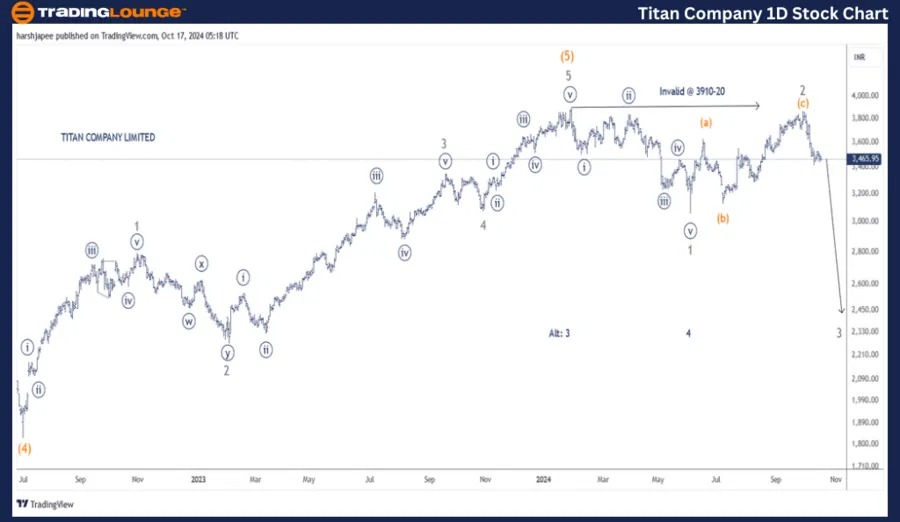
Titan Company daily chart technical analysis and potential Elliott Wave counts
Titan Company daily chart is suggesting a major top is in place around 3910-20 mark; potential Intermediate Wave (5) Orange termination. The stock has turned lower and managed to carve Minor Waves 1 and 2 Grey around 3060 and 3800 levels respectively. Potential Wave 3 Grey could be underway.
In July 2022, the stock had dropped through 1830 mark terminating Intermediate Wave (4) Orange. Since then, prices have rallied unfolding into fives waves marked as Minor Waves 1 through 5 here. If correct, a larger degree corrective wave is underway.
Alternatively, the top around 3910-20 could be Minor Wave 3, followed by Minor Wave 4 terminating around 3060 mark. In that case, Minor Wave 5 is progressing higher and should push through 3910-20 range going forward.
Titan Elliott Wave technical analysis
Function: Counter Trend (Intermediate Degree, Orange).
Mode: Corrective.
Structure: Impulse within larger degree Corrective Wave.
Position: Minor Wave 2 Grey.
Details: The stock might have carved a top around 3920 earlier. Furthermore, an impulse drop is seen to complete just above 3000 mark followed by a corrective rally through 3780-3870. The stock has now turned lower as Minor Wave 3 Grey unfolds against 3920. Alternative counts are marked on the chart, which shall be discussed if price action behaves accordingly. A break below 3145 would strengthen the bearish scenario.
Invalidation point: 3910-20.
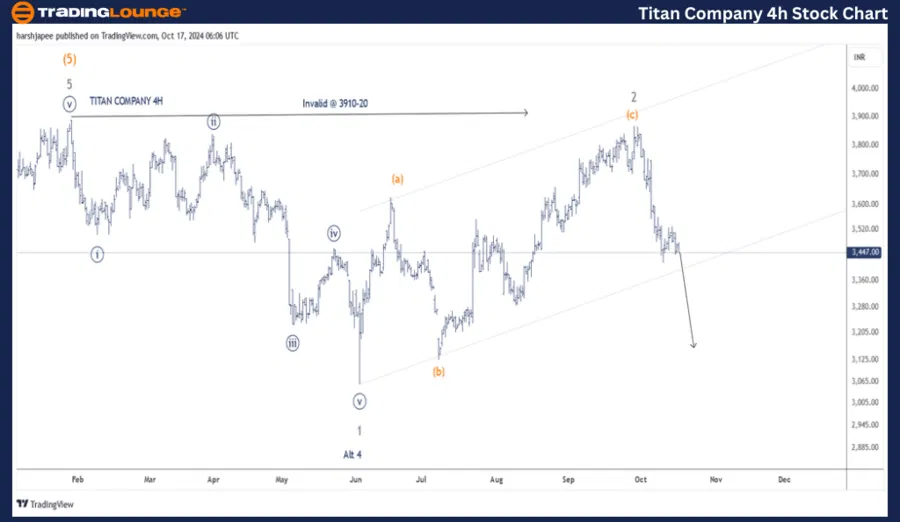
Titan Company four-hour chart technical analysis and potential Elliott Wave counts
Titan Company 4H chart is indicating potential impulse drop since 3910-20 high marked as Minor Wave 1, followed by a corrective rally through 3800 marked as Minor Wave 2. If correct, Minor Wave 3 is progressing lower now.
Conclusion
TITAN Company is progressing lower within Minor Wave 3 Grey against 3910-20.
Titan Company Elliott Wave technical analysis [Video]
Author

Peter Mathers
TradingLounge
Peter Mathers started actively trading in 1982. He began his career at Hoei and Shoin, a Japanese futures trading company.


