This volatility signal suggests a bigger drop ahead [Video]
![This volatility signal suggests a bigger drop ahead [Video]](https://editorial.fxstreet.com/images/TechnicalAnalysis/Volatility/silence-gm487551541-38898930_XtraLarge.jpg)
Watch the free-preview video below extracted from the WLGC session before the market opens on 06 Aug 2024 to find out the following:
-
The 3 characteristics in the S&P 500 that form a directional bias.
-
The significance of recent market volatility and how it compares to past corrections in the S&P 500.
-
Is the recent increase in the VIX signalling a buying opportunity or further market decline.
-
What should investors expect in the short-term and long-term.
-
And a lot more.
Market environment
The bullish vs. bearish setup is 50 to 257 from the screenshot of my stock screener below.
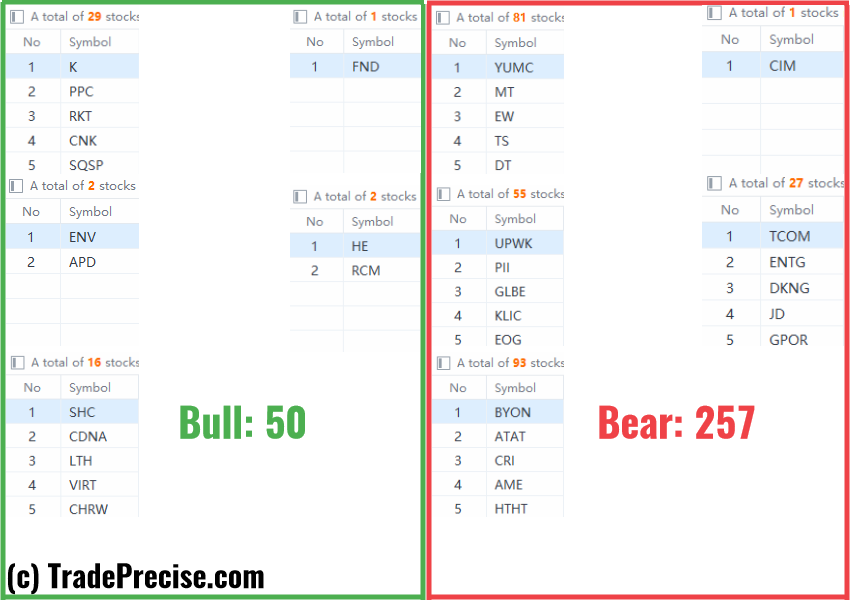
The risk-off mode started on the failure bar on 1 Aug 2024 as discussed in the video above quickly changed the market environment. This is further confirmed by the big gap down in the market breadth, which we did not experience this year.
Three stocks buck the trend
8 actionable setups MELI, RKT, GDDY were discussed during the live session before the market open (BMO).
Despite having a handful of the setups, my preference is to wait until the volatility settles down because trading in this elevated volatility environment is likely to get whipsawed.
I am holding cash and waiting for the born of the next batch of market leaders. No rush to jump in to trade the technical rally.
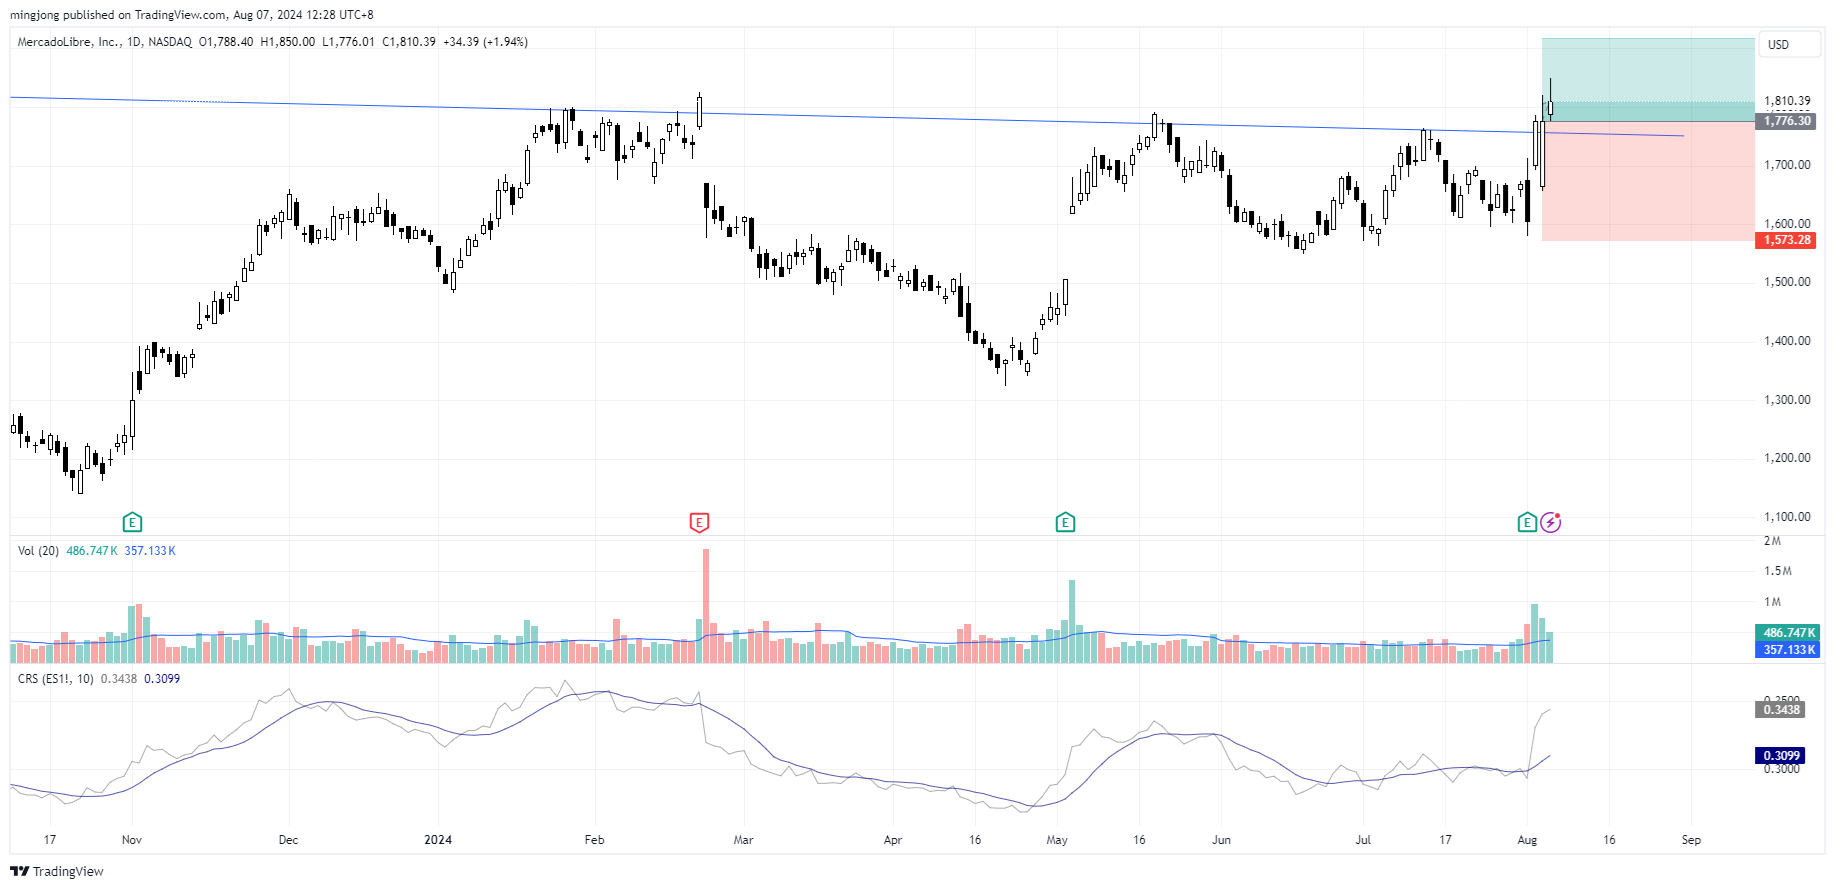
MELI
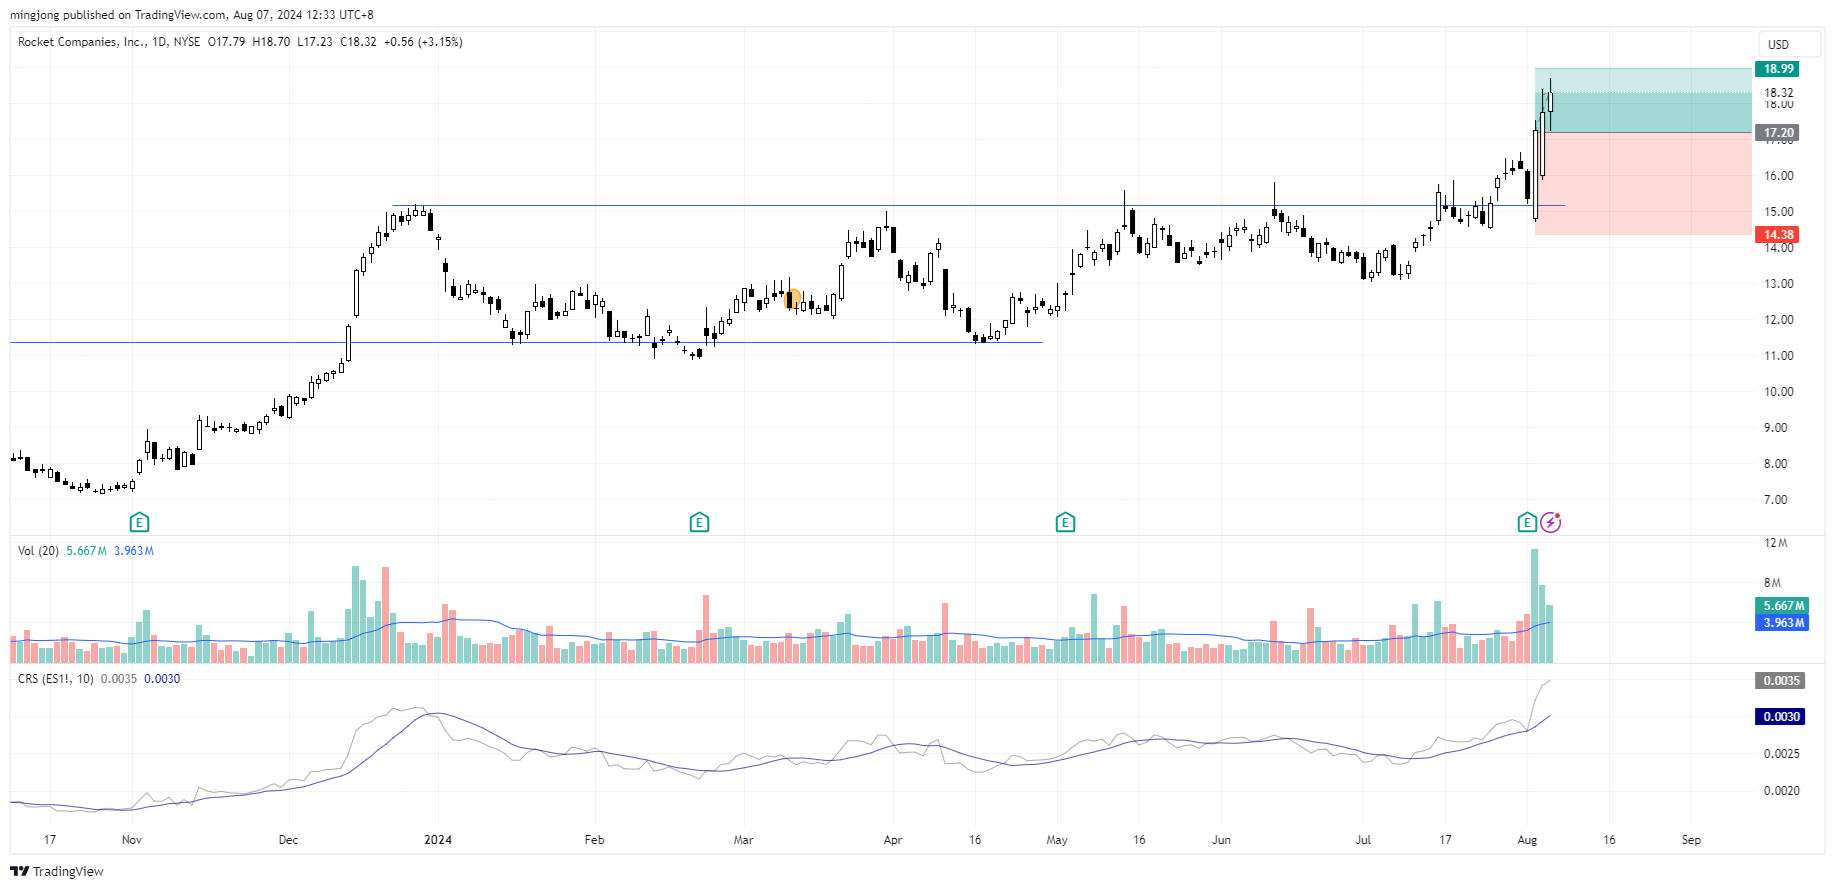
RKT
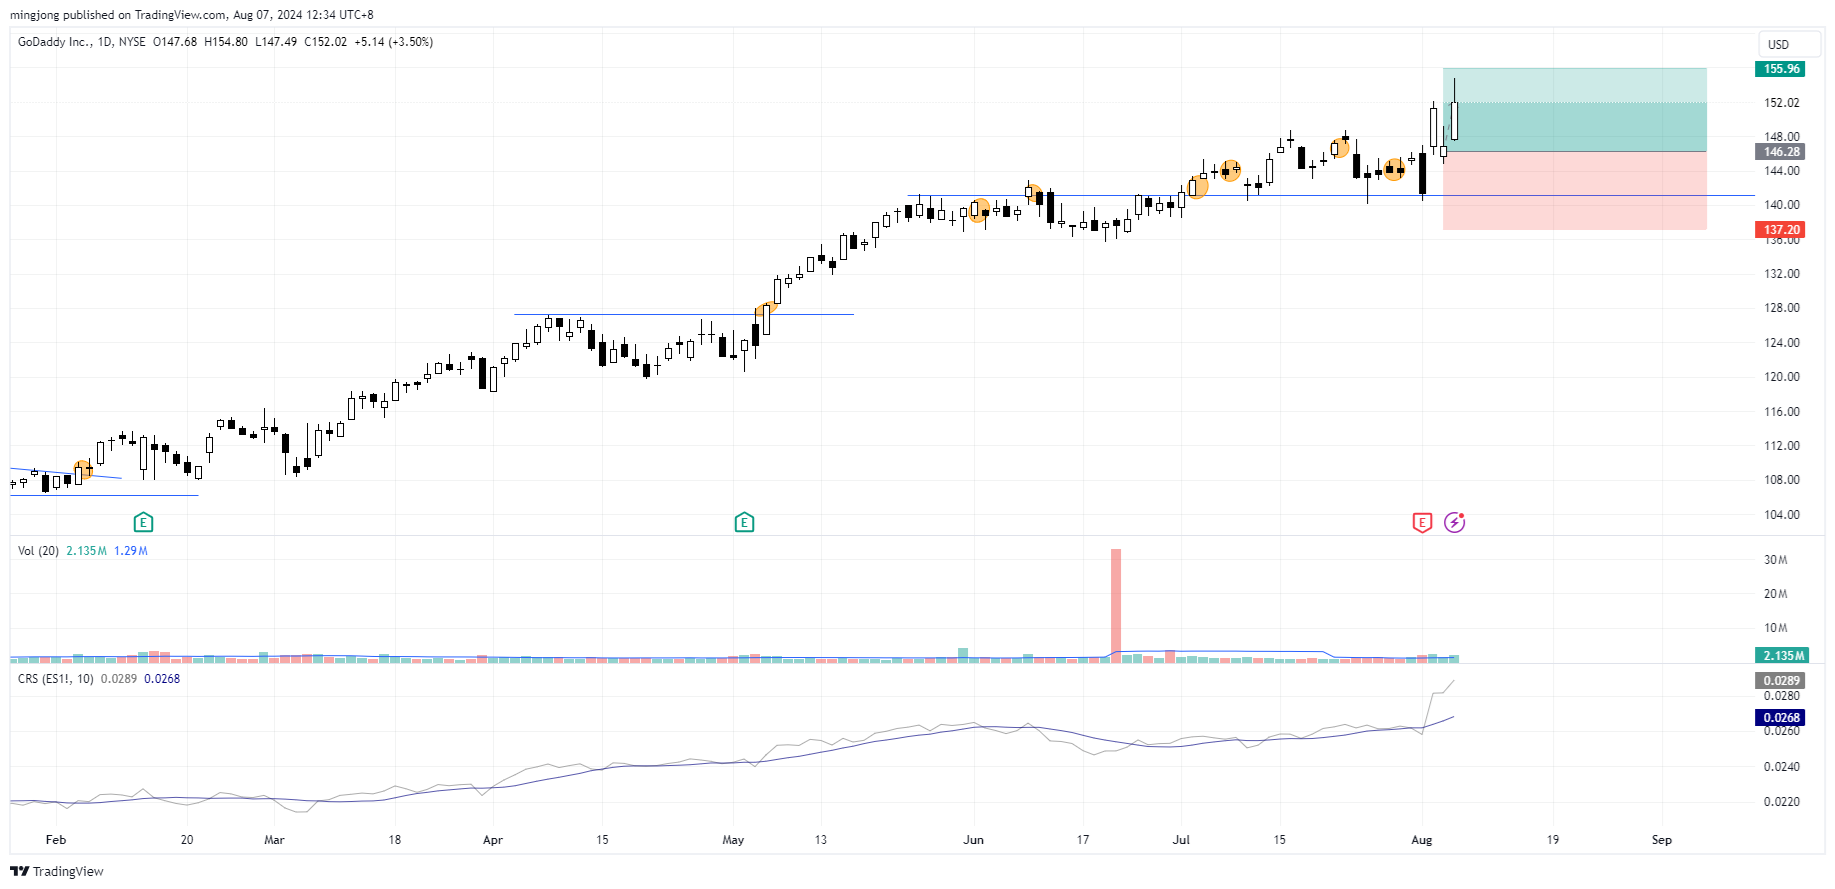
GDDY
Author

Ming Jong Tey
Independent Analyst
Ming Jong Tey has been trading since 2008. He started his learning journey from technical analysis (indicators, Fibonacci, etc...) to value investing. Throughout his journey, he develops an interest in price action with chart pattern trading.


