The Walt Disney Co. (DIS) Elliott Wave technical analysis [Video]
![The Walt Disney Co. (DIS) Elliott Wave technical analysis [Video]](https://editorial.fxstreet.com/images/Resources/uptrend-chart-16362472_XtraLarge.jpg)
DIS Elliott Wave technical analysis
Function: Trend
Mode: Impulsive
Structure: Motive
Position: Wave {iii} of 1.
Direction: Upside in wave 1.
Details: The longer term counts presents some challenges as it is yet unclear whether or not the longer correction is completed or not. As we are now trading above TradingLevel1 at 100$ we are gaining confidence in the upside potential to unveil.
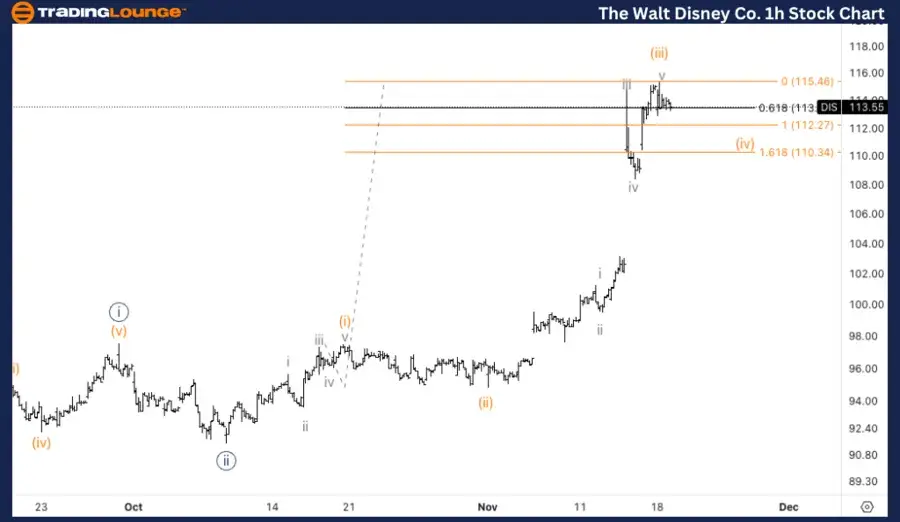
DIS Elliott Wave technical analysis – Daily chart
On the daily chart, Disney (DIS) is progressing in wave {iii} of 1 as part of a larger impulsive structure. The longer-term Elliott Wave count has some uncertainty due to the complex correction Disney has been in. However, breaking above TradingLevel1 at $100 has bolstered confidence in the upside scenario, suggesting that the correction may be over, and the stock is poised for further gains in this impulsive structure.
DIS Elliott Wave technical analysis
Function: Trend.
Mode: Impulsive.
Structure: Motive.
Position: Wave (iii) of {iii}.
Direction: Top in wave (iii).
Details: We seem to have topped in wave (iii) of {iii} after a sharp acceleration higher. Looking for a pullback in wave (iv) to end near the wave iv of one lesser degree, as well as around equality with the same degree wave (2) at around 112$.
DIS Elliott Wave technical analysis – One-hour chart
On the 1-hour chart, it appears that wave (iii) of {iii} has topped after a sharp move higher. The next expected move is a corrective wave (iv). The pullback could find support near the previous wave iv of one lesser degree, around the $112level, where it would also match equality with the preceding wave (2), setting the stage for the final push higher in wave (v).
In this Elliott Wave analysis, we will review the trend structure of The Walt Disney Co., (DIS) using both the daily and 1-hour charts to assess the current wave position and potential price movements.
The Walt Disney Co. (DIS) Elliott Wave technical analysis [Video]
Author

Peter Mathers
TradingLounge
Peter Mathers started actively trading in 1982. He began his career at Hoei and Shoin, a Japanese futures trading company.


