The Walt Disney Co. (DIS) Elliott Wave technical analysis [Video]
![The Walt Disney Co. (DIS) Elliott Wave technical analysis [Video]](https://editorial.fxstreet.com/images/Markets/Equities/Industries/Media/pic-gaming-637435367018133916_XtraLarge.jpg)
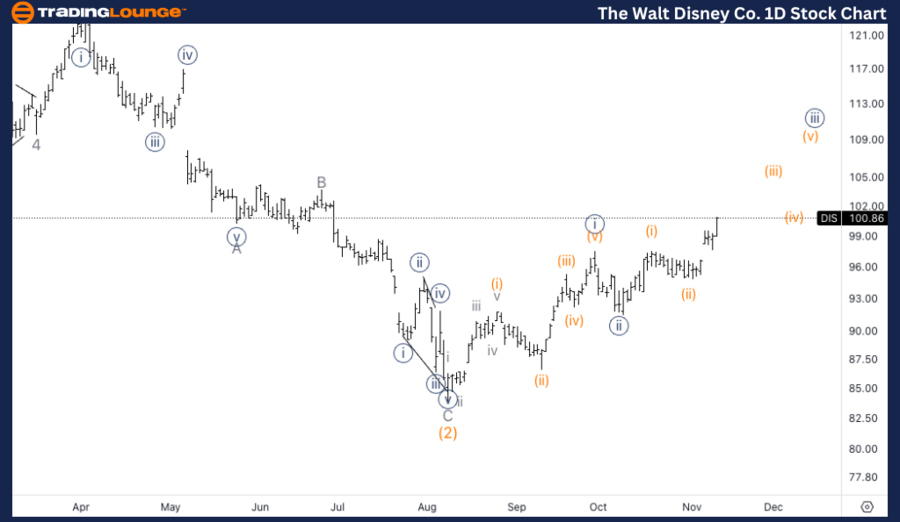
DIS Elliott Wave Analysis Trading Lounge Daily Chart,
The Walt Disney Co., (DIS) Daily Chart
DIS Elliott Wave technical analysis
Function: Trend.
Mode: Impulsive.
Structure: Motive.
Position: Wave {iii} of 1.
Direction: Upside in wave 1.
Details: The longer term counts presents some challenges as it is yet unclear whether or not the longer correction is completed or not. If we are to start trading above 100$ we could gain additional confluence in the upside resumption.
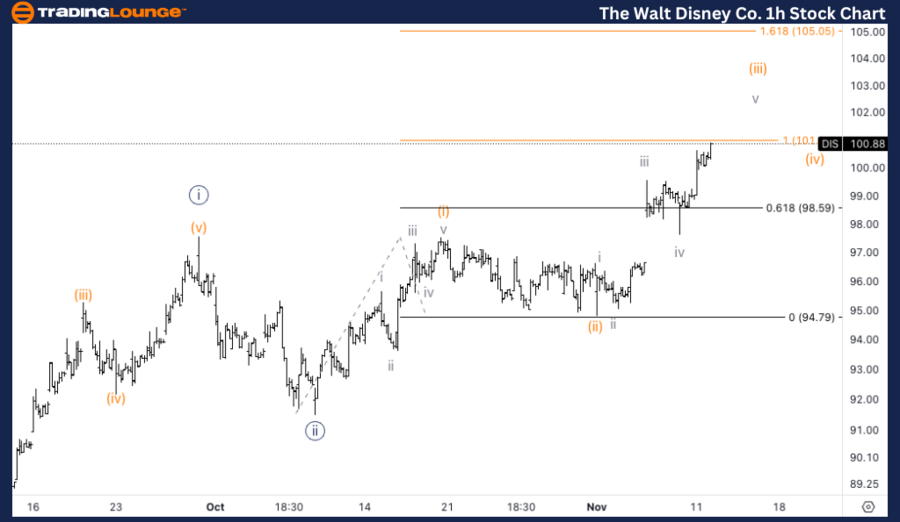
The Walt Disney Co., (DIS) 1H Chart.
DIS Elliott Wave technical analysis
Function: Trend.
Mode: Impulsive.
Structure: Motive.
Position: Wave (iii) of {iii}.
Direction: Top in wave (iii).
Details: Looking for upside in wave (iii) as we can see a nice five wave subdivision. Looking for a potential top as we approach equality of (iii) vs. (i) at 101$, knowing 1.618 at 105$ could also be reached.
In this Elliott Wave analysis, we will review the trend structure of The Walt Disney Co., (DIS) using both the daily and 1-hour charts to assess the current wave position and potential price movements.
DIS Elliott Wave technical analysis – Daily chart
The daily chart suggests that Walt Disney Co. is in the third wave ({iii}) of a larger wave 1 to the upside. However, there is still uncertainty regarding whether the broader correction has fully concluded. Trading above the $100 level would provide further confirmation of a potential longer-term uptrend. A break above this level would add confluence to the idea that a new bullish trend has begun, solidifying the wave count.
DIS Elliott Wave technical analysis – One-hour chart
The 1-hour chart is currently tracking wave (iii) of {iii}, with the potential for further upside. A nice five-wave subdivision can be observed in this wave, suggesting that the impulsive nature is intact. A possible top is anticipated as the price approaches equality between wave (iii) and wave (i) at $101. Additionally, the 1.618 Fibonacci extension for this wave stands at $105, which could also be a significant level to watch as the market potentially reaches the final stages of this wave.
Technical analyst: Alessio Barretta.
DIS Elliott Wave technical analysis [Video]
Author

Peter Mathers
TradingLounge
Peter Mathers started actively trading in 1982. He began his career at Hoei and Shoin, a Japanese futures trading company.


