|

USD/INR Price Analysis: Lacks any firm direction, stuck in a range around 100-day SMA

  • USD/INR oscillates in a narrow trading band through the Asian session on Wednesday.
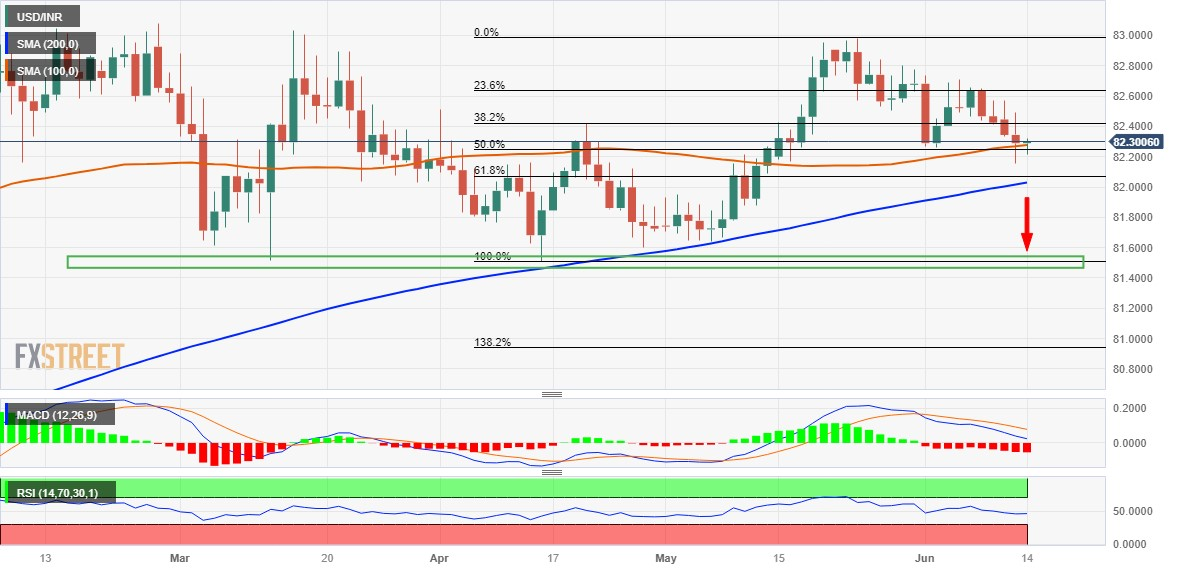
  • Failure to find acceptance below the 100-day SMA warrants caution for bearish traders.
  • A break below the 82.00 confluence is needed to support prospects for additional losses.

The USD/INR pair struggles to gain any meaningful traction on Wednesday and seesaws between tepid gains/minor losses through the Asian session. The pair currently trades around the 82.25-82.30 region, nearly unchanged for the day, and remains well within the striking distance of its lowest level since May 16 touched on Tuesday.

From a technical perspective, the USD/INR pair, so far, has been showing some resilience below the 100-day Simple Moving Average (SMA) and the 38.2% Fibonacci retracement level of the April-May rally. This makes it prudent to wait for some follow-through selling below the overnight swing low, around the 82.15 area, before placing fresh bearish bets. This is closely followed by the 82.00 confluence, comprising the very important 200-day SMA and the 61.8% Fibo. level.

A convincing break below the latter will mark a fresh breakdown and set the stage for an extension of the recent pullback from the vicinity of the 83.00 round figure. With oscillators on the daily chart just starting to gain negative traction, the USD/INR pair might then accelerate the downfall towards the 81.75 intermediate support en route to the March/April swing low, around 81.50 strong horizontal support.

On the flip side, the 38.2% Fibo. level, around the 82.40 region, now seems to act as an immediate hurdle. The next relevant resistance is pegged near the 82.60-82.65 zone, or the 23.6% Fibo. level, which if cleared might trigger a short-covering move. The USD/INR pair might then make a fresh attempt to conquer the 83.00 round-figure mark. Bulls might eventually aim to challenge the all-time high, around the 83.40-83.45 area touched in October 2022.

USD/INR daily chart

fxsoriginal

Key levels to watch

USD/INR

Overview
Today last price82.2932
Today Daily Change0.0040
Today Daily Change %0.00
Today daily open82.2892
 
Trends
Daily SMA2082.5791
Daily SMA5082.2005
Daily SMA10082.2688
Daily SMA20082.016
 
Levels
Previous Daily High82.4932
Previous Daily Low82.1575
Previous Weekly High82.712
Previous Weekly Low82.403
Previous Monthly High82.981
Previous Monthly Low81.6435
Daily Fibonacci 38.2%82.2857
Daily Fibonacci 61.8%82.3649
Daily Pivot Point S182.1334
Daily Pivot Point S281.9776
Daily Pivot Point S381.7978
Daily Pivot Point R182.4691
Daily Pivot Point R282.6489
Daily Pivot Point R382.8047

Author

Haresh Menghani

Haresh Menghani is a detail-oriented professional with 10+ years of extensive experience in analysing the global financial markets.

More from Haresh Menghani
Share:

Markets move fast. We move first.

Orange Juice Newsletter brings you expert driven insights - not headlines. Every day on your inbox.

By subscribing you agree to our Terms and conditions.

Editor's Picks

EUR/USD ticks lower following the release of FOMC Minutes

The US Dollar found some near-term demand following the release of the FOMC meeting minutes, with the EUR/USD pair currently piercing the 1.1750 threshold. The document showed officials are still willing to trim interest rates. Meanwhile, thinned holiday trading keeps major pairs confined to familiar levels.

GBP/USD remains sub- 1.3500, remains in the red

The GBP/USD lost traction early in the American session, maintaining the sour tone and trading around 1.3460 following the release of the FOMC meeting minutes. Trading conditions remain thin ahead of the New Year holiday, limiting the pair's volatility.

Gold stable above $4,350 as the year comes to an end

Gold price got to recover some modest ground on Tuesday, holding on to intraday gains and changing hands at $4,360 a troy ounce in the American afternoon. The bright metal showed no reaction to the release of the FOMC December meeting minutes.

Ethereum: ETH holds above $2,900 despite rising selling activity

Ethereum (ETH) held the $2,900 level despite seeing increased selling pressure over the past week. The Exchange Netflow metric showed deposits outweighed withdrawals by about 400K ETH. The high value suggests rising selling activity amid the holiday season.

Economic outlook 2026-2027 in advanced countries: Solidity test

After a year marked by global economic resilience and ending on a note of optimism, 2026 looks promising and could be a year of solid economic performance. In our baseline scenario, we expect most of the supportive factors at work in 2025 to continue to play a role in 2026.

Crypto market outlook for 2026

Year 2025 was volatile, as crypto often is.  Among positive catalysts were favourable regulatory changes in the U.S., rise of Digital Asset Treasuries (DAT), adoption of AI and tokenization of Real-World-Assets (RWA).