|

USD/CAD Price Analysis: Drops vertically to near 1.3300 as bets for neutral Fed policy remain solid

  • USD/CAD has shown a vertical fall to near 1.3300 due to a solid recovery in the oil price.
  • Market sentiment has turned extremely positive as a skip in the policy-tightening spell by the Fed will trim fears of US recession.
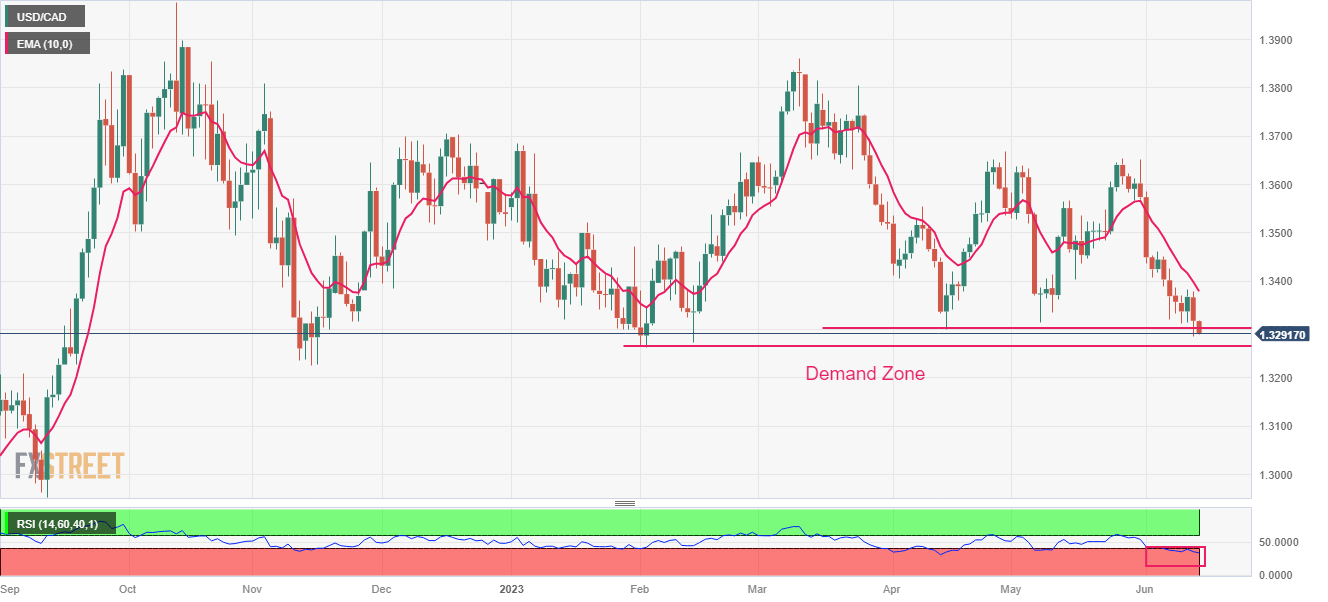
  • USD/CAD has tested the demand zone placed in a range of 1.3270-1.3300.

The USD/CAD pair has shown a perpendicular fall to the round-level support of 1.3300 after facing stiff barricades around 1.3320 in the European session. The Loonie asset has dropped sharply following the footprints of the US Dollar Index (DXY). It is observed that the pace of falling Loonie is higher than the velocity of decline in the USD Index.

Upbeat oil prices are providing a cushion to the Canadian Dollar as investors are hoping for a neutral interest rate policy by the Federal Reserve (Fed). Market sentiment has turned extremely positive as a skip in the policy-tightening spell by the Fed will trim fears of a recession in the United States.

Meanwhile, the street is hoping that the Bank of Canada (BoC) will continue raising interest rates further due to resilience in the Canadian economy. BoC Governor Tiff Macklem raised interest rates surprisingly by 25 basis points (bps) to 4.75% last week.

USD/CAD has tested the demand zone placed in a range of 1.3270-1.3300 on a daily scale. The Loonie is expected to remain volatile after the interest rate decision by the Fed. Downward-sloping 10-period Exponential Moving Average (EMA) at 1.3380 indicates that the short-term trend is extremely bearish.

The Relative Strength Index (RSI) (14) has shifted into the bearish range of 20.00-40.00, which indicates that the downside momentum is already active.

Should the asset break below June 13 low at 1.3286, Canadian Dollar bulls will expose the Loonie asset to 15 November 2022 low at 1.3226 followed by the round-level support at 1.3200.

On the flip side, a break above June 08 high at 1.3388 will drive the asset toward June 05 high at 1.3462 and the psychological resistance at 1.3500.

USD/CAD daily chart

USD/CAD

Overview
Today last price1.3293
Today Daily Change-0.0025
Today Daily Change %-0.19
Today daily open1.3318
 
Trends
Daily SMA201.3478
Daily SMA501.3484
Daily SMA1001.3515
Daily SMA2001.3516
 
Levels
Previous Daily High1.3379
Previous Daily Low1.3286
Previous Weekly High1.3462
Previous Weekly Low1.3313
Previous Monthly High1.3655
Previous Monthly Low1.3315
Daily Fibonacci 38.2%1.3321
Daily Fibonacci 61.8%1.3343
Daily Pivot Point S11.3277
Daily Pivot Point S21.3235
Daily Pivot Point S31.3184
Daily Pivot Point R11.3369
Daily Pivot Point R21.342
Daily Pivot Point R31.3462

Author

Sagar Dua

Sagar Dua

FXStreet

Sagar Dua is associated with the financial markets from his college days. Along with pursuing post-graduation in Commerce in 2014, he started his markets training with chart analysis.

More from Sagar Dua
Share:

Editor's Picks

EUR/USD: US Dollar to remain pressured until uncertainty fog dissipates

Unimpressive European Central Bank left monetary policy unchanged for the fifth consecutive meeting. The United States first-tier employment and inflation data is scheduled for the second week of February. EUR/USD battles to remain afloat above 1.1800, sellers moving to the sidelines.

GBP/USD softens to near 1.3600 as BoE hints further rate cuts

The GBP/USD pair loses ground to near 1.3610 during the early Asian session on Monday. The Pound Sterling softens against the Greenback amid growing expectations of the Bank of England’s interest-rate cut. Traders will take more cues from the Fedspeak later on Monday.

Gold holds gains near $5,000 as China's gold buying drives demand

Gold price clings to the latest uptick near $5,000 in Asian trading on Monday. The precious metal holds its recovery amid a weaker US Dollar and rising demand from the Chinese central bank. The delayed release of the US employment report for January will be in the spotlight later this week.

Bitcoin Weekly Forecast: The worst may be behind us

Bitcoin price recovers slightly, trading at $65,000 at the time of writing on Friday, after reaching a low of $60,000 during the early Asian trading session. The Crypto King remained under pressure so far this week, posting three consecutive weeks of losses exceeding 30%.

Weekly column: Saturn-Neptune and the end of the Dollar’s 15-year bull cycle

Tariffs are not only inflationary for a nation but also risk undermining the trust and credibility that go hand in hand with the responsibility of being the leading nation in the free world and controlling the world’s reserve currency.

XRP rally extends as modest ETF inflows support recovery

Ripple is accelerating its recovery, trading above $1.36 at the time of writing on Friday, as investors adjust their positions following a turbulent week in the broader crypto market. The remittance token is up over 21% from its intraday low of $1.12.