The Procter & Gamble Company (PG) Elliott Wave technical analysis [Video]
![The Procter & Gamble Company (PG) Elliott Wave technical analysis [Video]](https://editorial.fxstreet.com/images/TechnicalAnalysis/ChartPatterns/PointFigure/hand-pointing-graph-elements-of-this-image-furnished-by-nasa-76654497_XtraLarge.jpg)
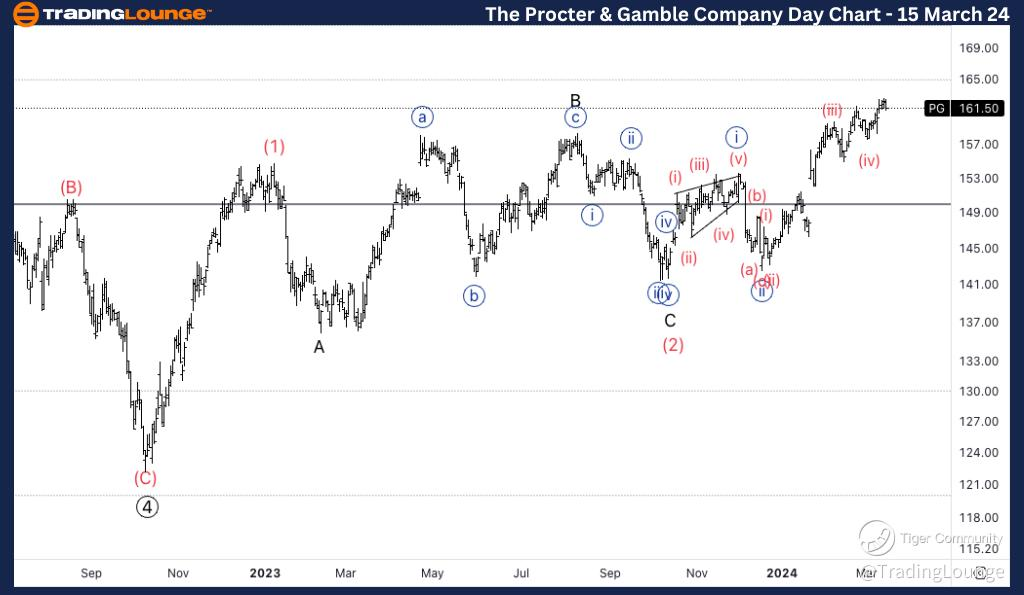
PG Elliott Wave technical analysis
Function: Trend.
Mode: Impulsive.
Structure: Motive.
Position: Wave (3).
Direction: Upside in wave 1 of (3).
Details: We are still trading below ATH, as we are approaching the bottom of MG2 at 165$ where we are expecting resistance.
PG Elliott Wave technical analysis – Daily chart
In our analysis, we identify a trending function characterized by impulsive mode and motive structure. Positioned in Wave (3), our focus is on the upside movement in wave 1 of (3). While we're still trading below the all-time high (ATH), we anticipate encountering resistance as we approach the bottom of MG2 at $165.
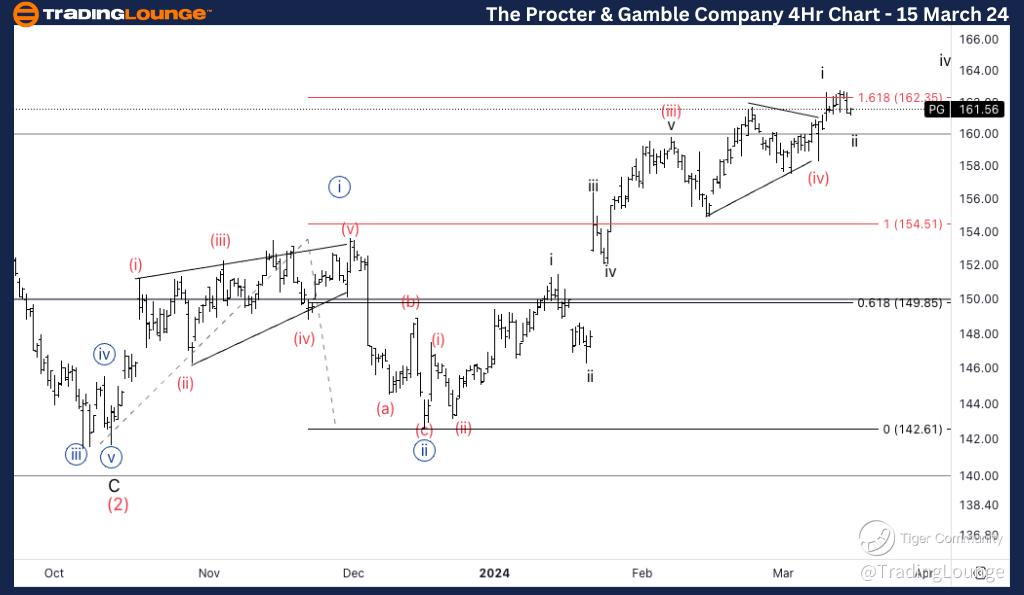
PG Elliott Wave technical analysis
Function: Trend.
Mode: Impulsive.
Structure: Motive.
Position: Wave (v) of {iii}.
Direction: Upside into wave (v).
Details: Looking for further upside into wave (v) as we could have completed wave i of (v). As mentioned, I’d expect 165$ to act as resistance, even if we have touched 1618 {iii} vs. {i} at 162$.
PG Elliott Wave technical analysis – Four-hour chart
Here, we also observe a trending function marked by impulsive mode and motive structure. Positioned in Wave (v) of {iii}, our attention is on the upside movement into wave (v). We anticipate further upward momentum, considering the possibility of completing wave i of (v). Despite touching $162, we expect $165 to serve as resistance, especially given its significance in the Elliott Wave framework.
The Procter & Gamble Company (PG) Elliott Wave technical analysis [Video]
Author

Peter Mathers
TradingLounge
Peter Mathers started actively trading in 1982. He began his career at Hoei and Shoin, a Japanese futures trading company.


