The Home Depot (HD) Elliott Wave technical analysis [Video]
![The Home Depot (HD) Elliott Wave technical analysis [Video]](https://editorial.fxstreet.com/images/TechnicalAnalysis/ChartPatterns/Chartism/stock-market-chart-with-pen-23290418_XtraLarge.jpg)
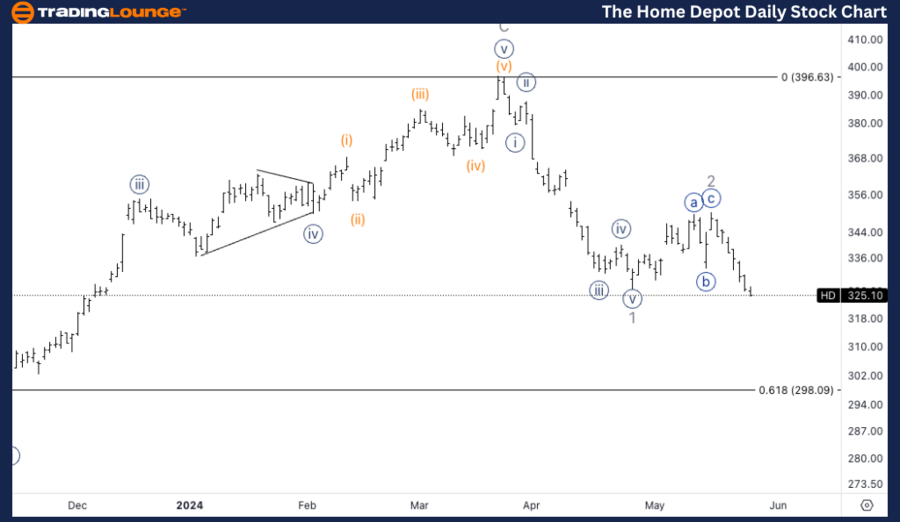
HD Elliott Wave Analysis Trading Lounge Daily Chart.
HD Elliott Wave technical analysis
Function: Trend.
Mode: Impulsive.
Structure: Motive.
Position: Minor wave 3.
Direction: Downside in Minor 3.
Details: Looking for downside into minor wave 3, with equality of 3 vs. 1 at 288.
HD Elliott Wave technical analysis – Daily chart
In our Elliott Wave analysis of The Home Depot (HD) on May 27, 2024, we observe an impulsive trend characterized by a motive structure. HD is currently positioned in Minor wave 3, indicating downside movement in Minor 3. The equality of 3 vs. 1 suggests a target at $288. The daily chart shows a bearish trend as we move into Minor wave 3. Traders should watch for price action near this level to confirm the continuation of the downtrend.
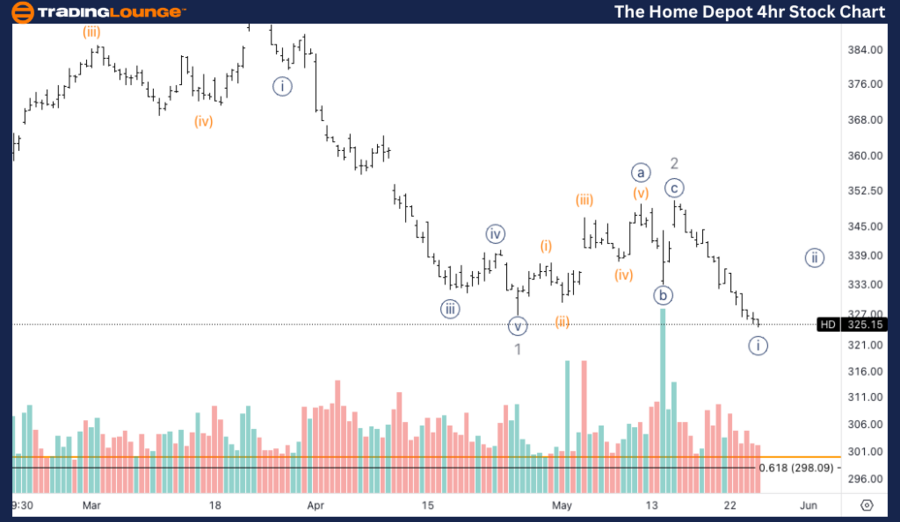
HD Elliott Wave technical analysis – Four-hour chart
On the 4-hour chart, HD is following an impulsive trend within a motive structure, specifically in wave {i} of 3. The current analysis shows that we are looking for a pullback in wave {ii} to then.
Function: Trend.
Mode: Impulsive.
Structure: Motive.
Position: Wave {i} of 3.
Direction: Pullback in wave {ii}.
Details: Looking for a pullback in wave {ii} to then look shorts from. Volume diminishing suggests we could be near the end of {i}.
Welcome to our latest Elliott Wave analysis for The Home Depot (HD) as of May 27, 2024. This analysis provides an in-depth look at HD's price movements using the Elliott Wave Theory, helping traders identify potential opportunities based on current trends and market structure. We will cover insights from both the daily and 4-hour charts to offer a comprehensive perspective on HD's market behavior.
The Home Depot (HD) Elliott Wave technical analysis [Video]
Author

Peter Mathers
TradingLounge
Peter Mathers started actively trading in 1982. He began his career at Hoei and Shoin, a Japanese futures trading company.


