The Coca-Cola Company (KO) Elliott Wave technical analysis [Video]
![The Coca-Cola Company (KO) Elliott Wave technical analysis [Video]](https://editorial.fxstreet.com/images/Markets/Equities/Industries/EnergyStocks/gas-electricity-637435385726449784_XtraLarge.jpg)
KO Elliott Wave Analysis Trading Lounge Daily Chart,
The Coca-Cola Company, (KO) Daily Chart.
KO Elliott Wave technical analysis
Function: Trend.
Mode: Impulsive.
Structure: Motive.
Position: Wave 3.
Direction: Upside in wave 3.
Details: Looking for a correction in wave {iv} to be near completion to the resume higher and complete higher degree wave 3, ideally at 80$.

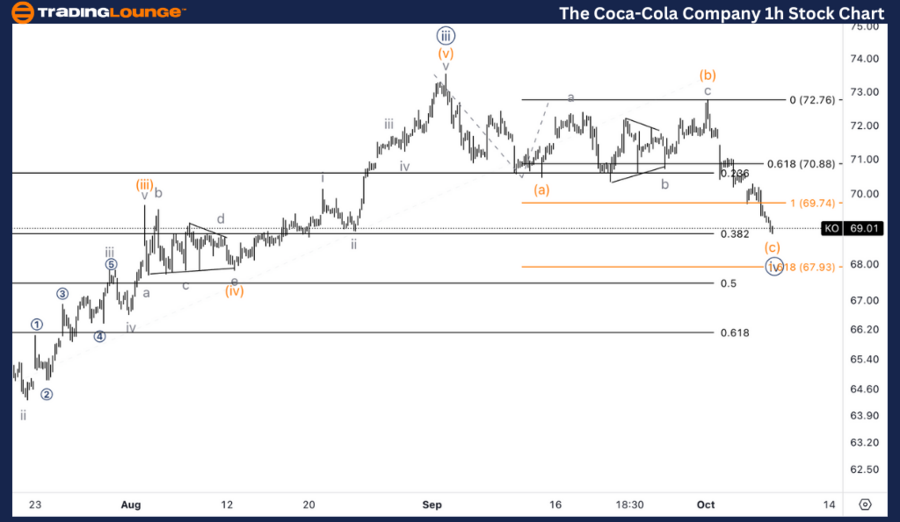
The Coca-Cola Company, (KO) 1H Chart.
KO Elliott Wave technical analysis
Function: Counter Trend.
Mode: Corrective.
Structure: Flat.
Position: Wave (c) of {iv}.
Direction: Bottom in wave (c).
Details: Looking for a bottom in wave (c), as we have reached equality of (c) vs (a) as well as we have reached 38.2% retracement of the advance in wave {iii}.
In this Elliott Wave analysis, we will review the trend structure of The Coca-Cola Company (KO) using both the daily and 1-hour charts to assess the current wave position and potential price movements.
KO Elliott Wave technical analysis – Daily chart
On the daily chart, Coca-Cola (KO) is in wave 3 of a larger impulsive structure, and a correction in wave {iv} is expected to be near completion. Once this corrective phase ends, the stock should resume its upward trajectory, aiming for a target around 80 USD, which would likely complete the larger-degree wave 3.
KO Elliott Wave technical analysis – One-hour chart
On the 1-hour chart, the structure is currently undergoing a flat correction within wave (c) of {iv}. The wave (c) is nearing a potential bottom, as it has reached equality of wave (c) vs (a) and retraced to 38.2% of the previous advance in wave {iii}.
Technical analyst: Alessio Barretta.
KO Elliott Wave technical analysis [Video]
Author

Peter Mathers
TradingLounge
Peter Mathers started actively trading in 1982. He began his career at Hoei and Shoin, a Japanese futures trading company.


