The Coca-Cola Company (KO) Elliott Wave technical analysis [Video]
![The Coca-Cola Company (KO) Elliott Wave technical analysis [Video]](https://editorial.fxstreet.com/images/Markets/Equities/Industries/Software/software-code-637435356353853480_XtraLarge.jpg)
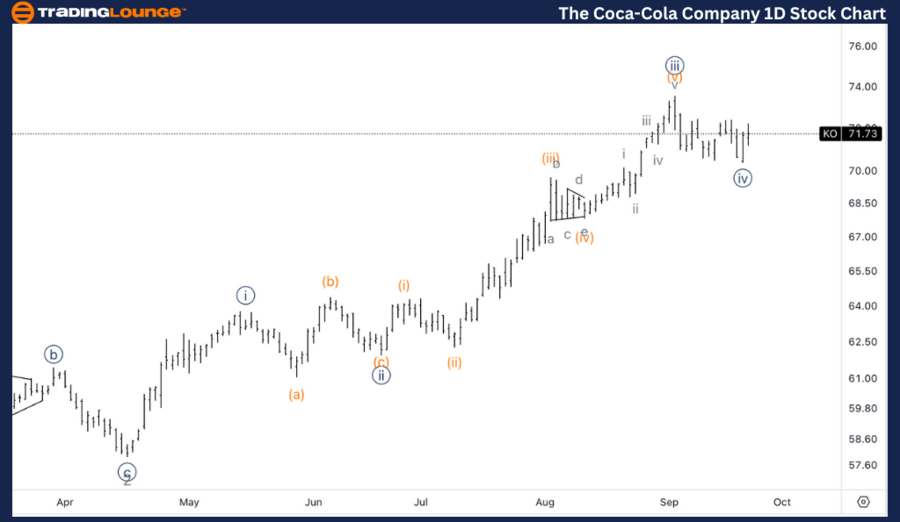
KO Elliott Wave Analysis Trading Lounge Daily Chart,
The Coca-Cola Company, (KO) Daily Chart.
KO Elliott Wave technical analysis
Function: Trend.
Mode: Impulsive.
Structure: Motive.
Position: Wave 3.
Direction: Upside in wave 3.
Details: Looking for the last push up into wave {v} of 3 as we have been correcting around the middle of MG2 at 72$. Looking for 80$ as upside target for wave 3.
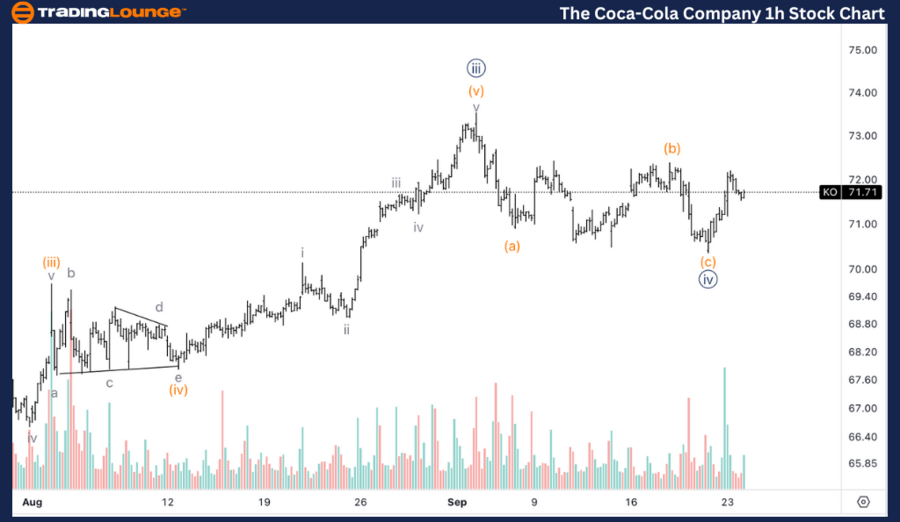
The Coca-Cola Company, (KO) 1H Chart.
KO Elliott Wave technical analysis
Function: Trend.
Mode: Impulsive.
Structure: Motive.
Position: Wave (i) of {v}.
Direction: Upside in wave {v}.
Details: We seem to have what appears to be a clear three wave move into wave {iv}. We have been moving higher with increasing volume which seems to be suggesting the low could be in place.
In this Elliott Wave analysis for The Coca-Cola Company (KO), we will examine the current price action and wave structure to provide insights into potential trading opportunities. We will analyze both the daily and 1-hour charts for a comprehensive view of KO's trend and momentum.
KO Elliott Wave technical analysis – Daily chart
On the daily chart, Coca-Cola is progressing through an impulsive mode in Wave 3 of the overall Elliott Wave structure. The stock is currently consolidating around the middle of MinorGroup2 (MG2) at $72, indicating a brief correction before the next move higher.
The focus is on the final push up into Wave {v} of 3, targeting $80 as the upside goal for the completion of Wave 3. This level could act as a significant resistance point as the wave structure nears completion. Traders should be prepared for potential consolidation once this target is reached.
KO Elliott Wave technical analysis – One-hour chart
On the 1-hour chart, Coca-Cola is in the early stages of Wave (i) of {v}, with the price trending higher as it progresses through Wave {v}. The stock recently completed a three-wave corrective structure in Wave {iv}, and the subsequent rise with increasing volume suggests that the correction has ended, and a new impulsive leg is beginning.
This indicates a potential low is already in place, and the next move higher within Wave {v} could drive the stock toward the $80 target mentioned on the daily chart.
Technical Analyst: Alessio Barretta.
KO Elliott Wave technical analysis [Video]
Author

Peter Mathers
TradingLounge
Peter Mathers started actively trading in 1982. He began his career at Hoei and Shoin, a Japanese futures trading company.


