The Coca-Cola Company (KO) Elliott Wave technical analysis [Video]
![The Coca-Cola Company (KO) Elliott Wave technical analysis [Video]](https://editorial.fxstreet.com/images/Markets/Equities/Industries/Food/water-bottles_XtraLarge.jpg)
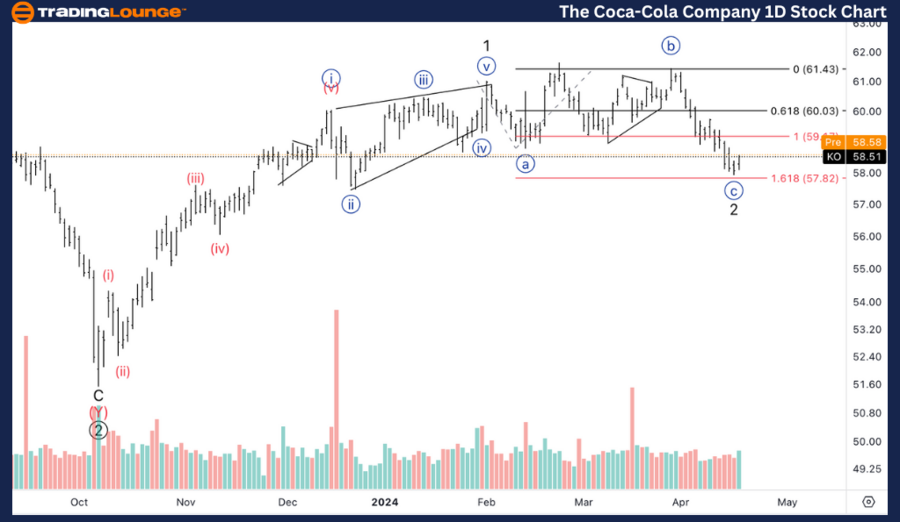
KO Elliott Wave technical analysis
Function: Counter Trend
Mode: Corrective
Structure: Flat
Position: Minute wave {c} of 2.
Direction Bottom in wave {c}.
Details: With yesterday’s session we’ve had a spike in volume on the bull side, which could make us start thinking the correction is either completed, or soon to be. We have almost reached 1.618 {c} vs. {a}., but more importantly we have reached the base of the leading diagonal in wave 1, where many times support is found.
KO Elliott Wave technical analysis – Daily chart
The Elliott Wave analysis on the daily chart of Coca-Cola shows a corrective phase within a flat structure, identified as minute wave {c} of 2. This phase is categorized under a counter trend function, suggesting that the ongoing correction is approaching completion. The recent trading session marked a significant increase in volume on the bullish side, hinting at a nearing end to the correction. Technically, the price has approached the critical 1.618 Fibonacci extension of wave {c} relative to {a}, reaching a key support level at the base of the leading diagonal from wave 1—a typical zone for finding support.
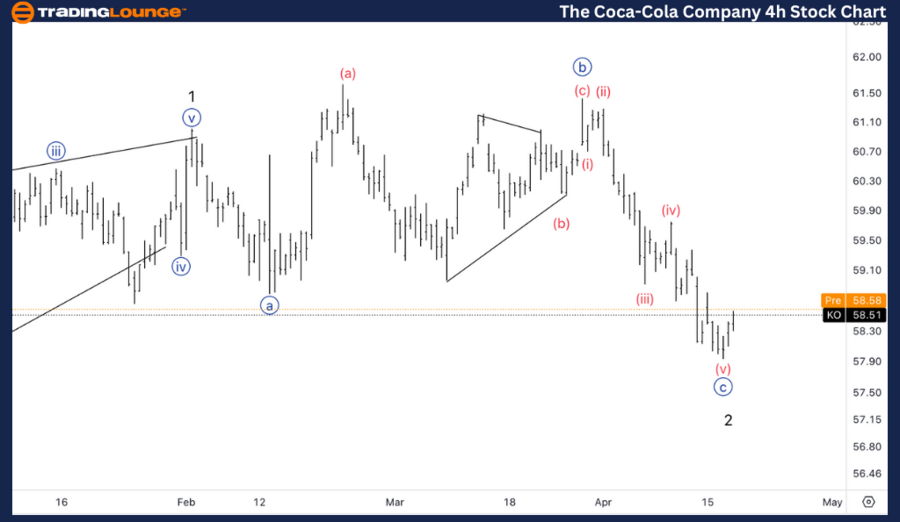
KO Elliott Wave technical analysis
Function: Counter Trend.
Mode: Corrective.
Structure: Flat.
Position: Wave (v) of {c}.
Direction: Bottom in wave (v).
Details: Here on the intraday chart it’s easier to see the five wave move in wave {c} which seems to have unfolded nicely. Looking for a clear sign of a bottom in place.
KO Elliott Wave technical analysis – Four-hour chart
On the 4-hour chart, Coca-Cola’s stock exhibits a detailed structure of the corrective phase, clearly depicting wave (v) of {c}. This finer resolution allows for a clearer visualization of the complete five-wave move within wave {c}, indicating the likelihood of a bottom formation. Analysts are keenly observing for definitive signs that confirm the bottom is firmly in place, signaling potential bullish reversals.
The Coca-Cola Company (KO) Elliott Wave technical analysis [Video]
Author

Peter Mathers
TradingLounge
Peter Mathers started actively trading in 1982. He began his career at Hoei and Shoin, a Japanese futures trading company.


