The bear case: Bull flag failure [Video]
![The bear case: Bull flag failure [Video]](https://editorial.fxstreet.com/images/TechnicalAnalysis/Positioning/wall-street-bull-gm531163035-55312452_XtraLarge.jpg)
Watch the free-preview video from the WLGC session before the market opens on 3 Sep 2024 to find out the following:
-
The signal that traders need to seek for to confirm the bullish flag.
-
The key support zone that S&P 500 could visit should the failure of the bull flag shows up.
-
How to judge the volume level to form a directional bias.
-
And a lot more.
Market update (4 Sep 2024)
- There was a spike of the supply level in conjunction with a bearish commitment below the bull flag support at 5580.
- This is likely the overdue test of the previous down swing from 17 Jul-5 Aug.
- A complex trading range as discussed in the video is still unfolding.
- During a market pullback is the best time to look for relative strength in the stocks.
Market environment
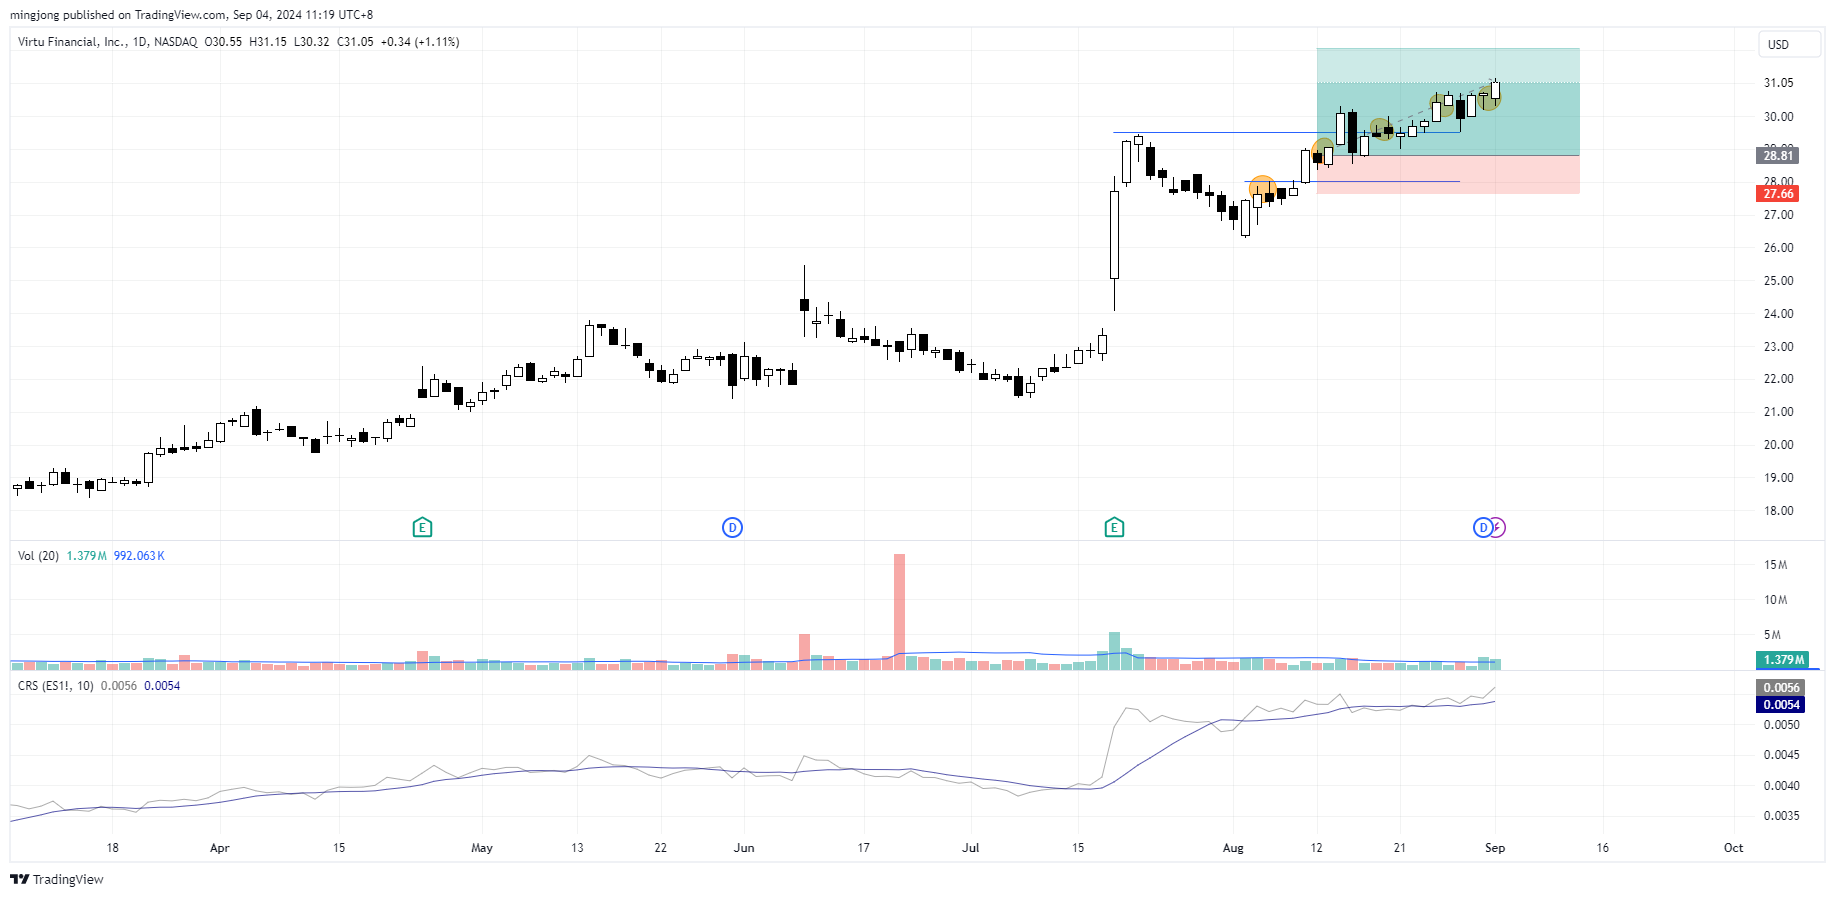
The bullish vs. bearish setup is 910 to 46 from the screenshot of my stock screener below.
Three stocks ready to soar
9 “low-hanging fruits” trade entries setups & 27 actionable setups such as were discussed during the live session before the market open (BMO).
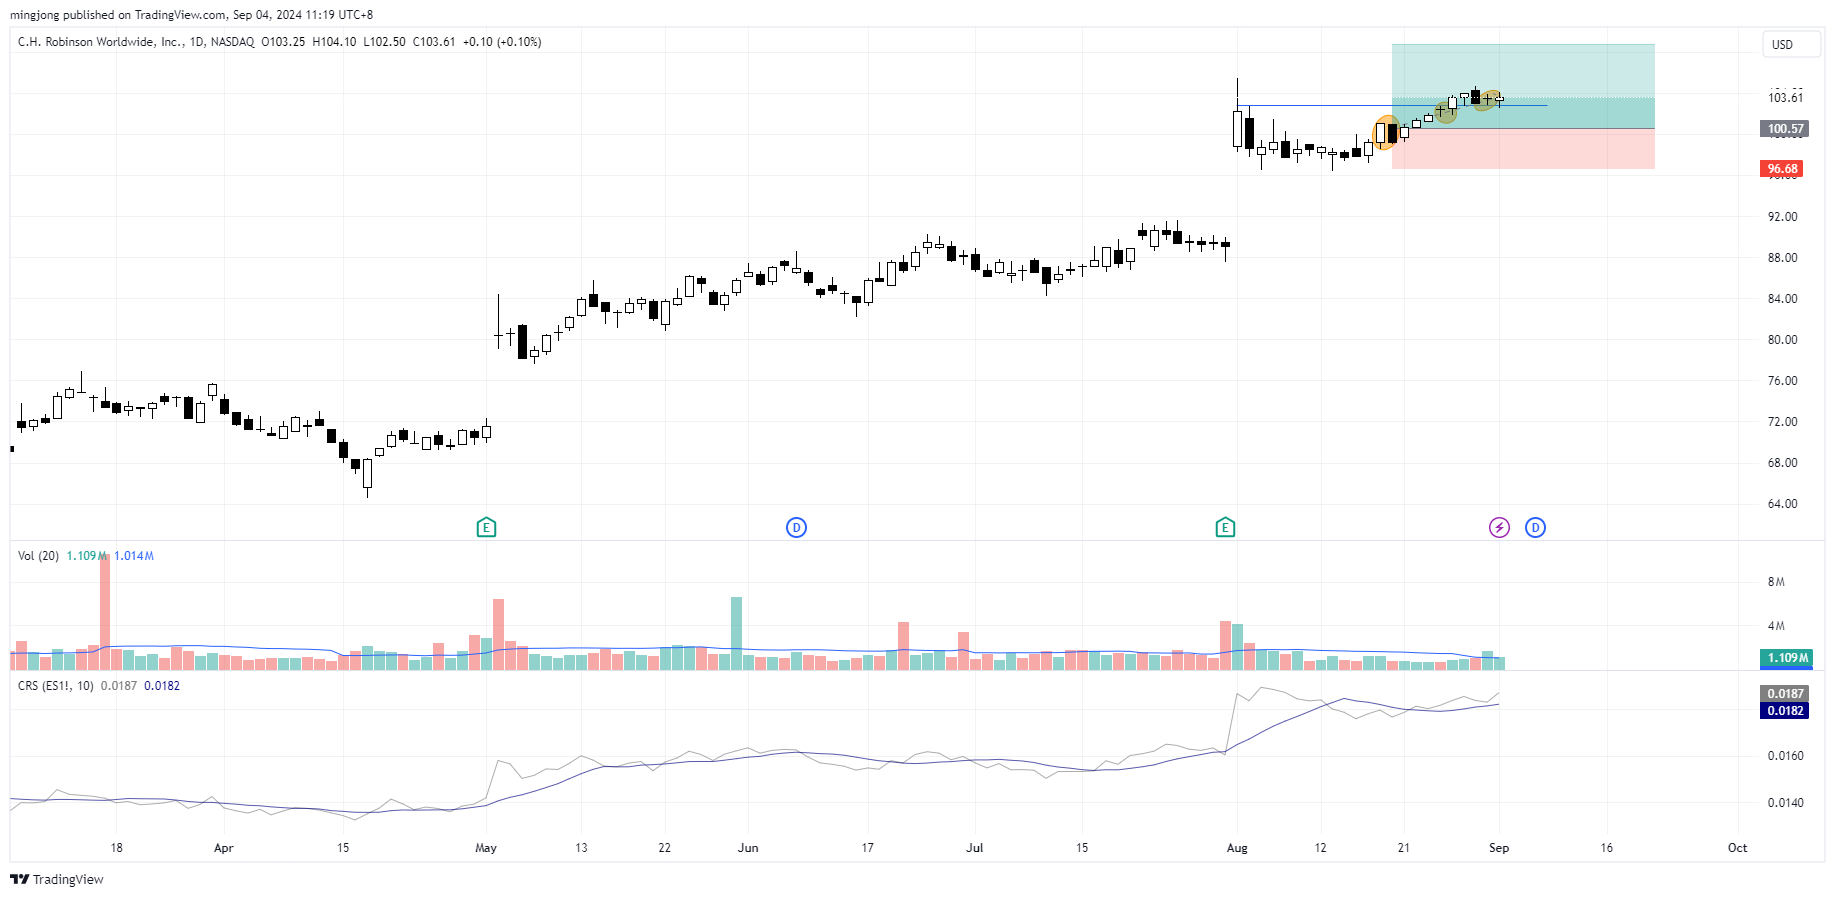
While the market is taking a hit, we will look for those who drop the least or even bucking the trend, such as VIRT, CHRW, SN.
Be patient and wait until the market is ready for a turn or to test the water with smaller position size in the stocks showing outperformance.
VIRT
CHRW
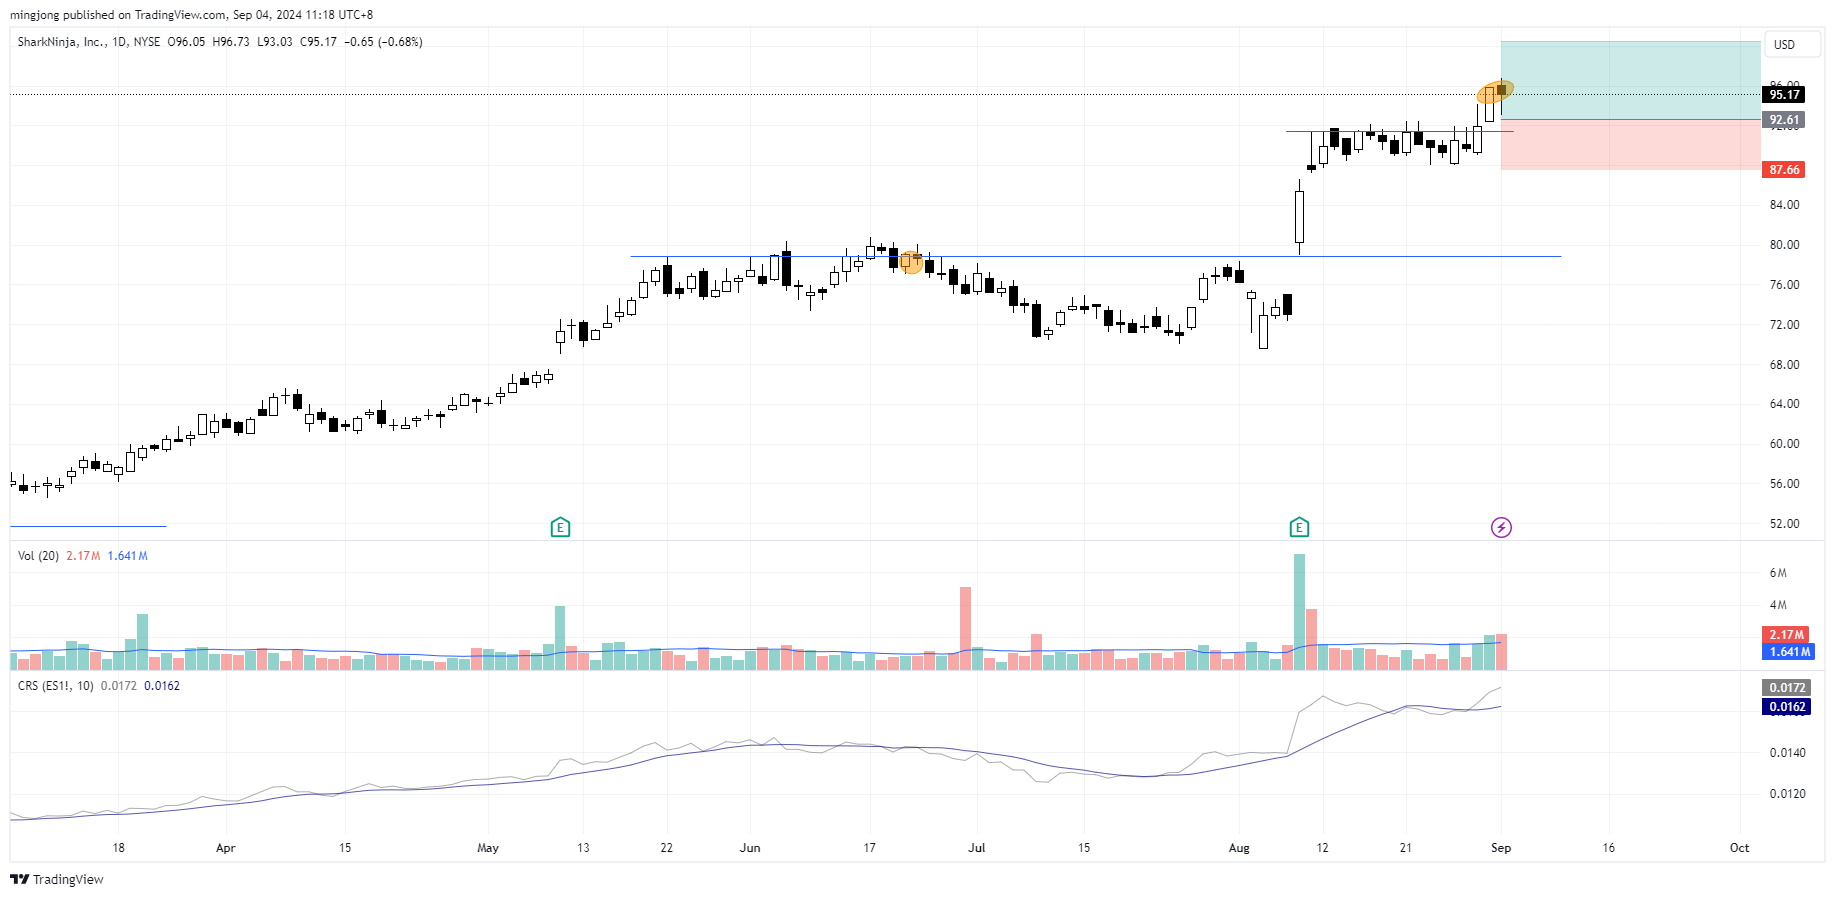
SN
Author

Ming Jong Tey
Independent Analyst
Ming Jong Tey has been trading since 2008. He started his learning journey from technical analysis (indicators, Fibonacci, etc...) to value investing. Throughout his journey, he develops an interest in price action with chart pattern trading.


