TXN Elliott Wave Analysis Trading Lounge Daily Chart,
Texas Instruments Inc., (TXN) Daily Chart
TXN Elliott Wave technical analysis
Function: Trend.
Mode: Impulsive.
Structure: Motive.
Position: Minor wave 3.
Direction: Upside in wave 3.
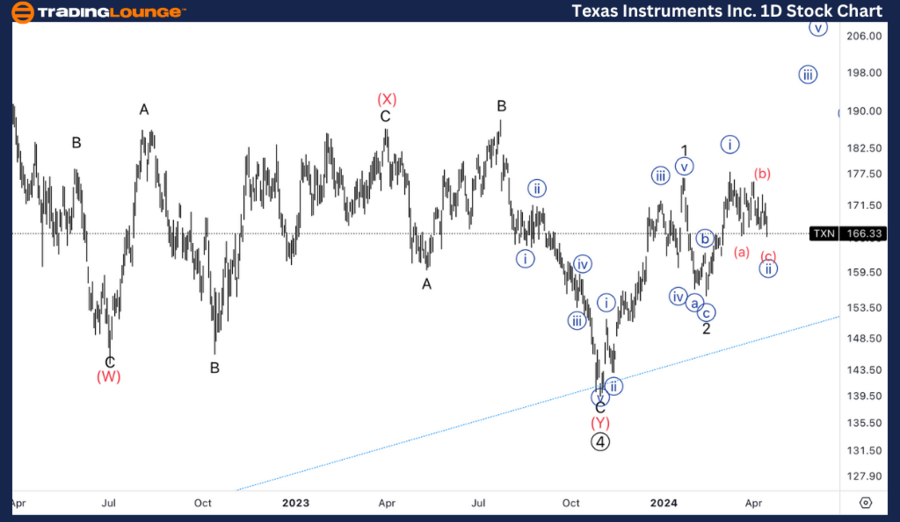
Details: We are looking at either an extension in Minor wav 3 in the making, or else we are still in wave {b} of 2. The most bearish scenario is the one where the move off the 140$ bottom is not a wave 1 and we are still in a larger degree correction.
Welcome to our TXN Elliott Wave Analysis Trading Lounge, where we delve into Texas Instruments Inc. (TXN) using Elliott Wave Technical Analysis. Let's dissect the market dynamics on both the Daily Chart and the 4H Chart as of April 15, 2024.
TXN Elliott Wave technical analysis – Daily chart
On the Daily Chart, our analysis reveals a trending market characterized by impulsive mode and motive structure, positioned in Minor wave 3. The direction indicates upside momentum in wave 3. However, we are considering two potential scenarios: either an extension in Minor wave 3 or still within wave {b} of 2. The most bearish scenario suggests that the move from the $140 bottom may not be a wave 1, implying a larger degree correction.
TXN Elliott Wave Analysis Trading Lounge 4Hr Chart,
Texas Instruments Inc., (TXN) 4Hr Chart.
TXN Elliott Wave technical analysis
Function: Counter Trend.
Mode: Corrective.
Structure: Flat.
Position: Wave {ii}.
Direction: Bottom in wave (c) of {ii}.
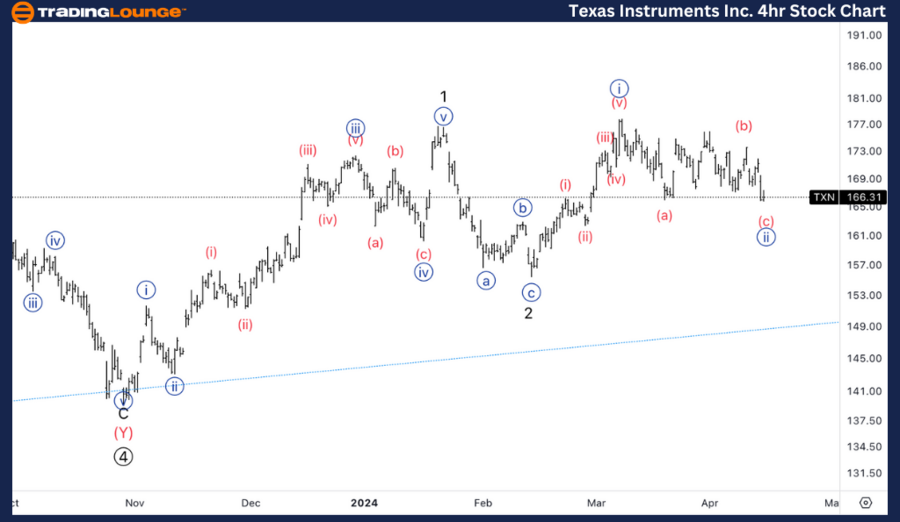
Details: We are looking at a clear three wave move in wave {ii} with a bottom soon to be in place, looking for the beginning of MGM2 at 165$ to provide support.
TXN Elliott Wave technical analysis – Four-hour chart
Here, we observe a counter trend market marked by corrective mode and flat structure, positioned in Wave {ii}. The direction hints at a bottom forming in wave (c) of {ii}. Our analysis identifies a clear three-wave move in wave {ii}, with a bottom expected soon. We anticipate support to emerge around the beginning of MGM2 at $165.
Technical analyst: Alessio Barretta.
TXN Elliott Wave technical analysis [Video]
As with any investment opportunity there is a risk of making losses on investments that Trading Lounge expresses opinions on.
Historical results are no guarantee of future returns. Some investments are inherently riskier than others. At worst, you could lose your entire investment. TradingLounge™ uses a range of technical analysis tools, software and basic fundamental analysis as well as economic forecasts aimed at minimizing the potential for loss.
The advice we provide through our TradingLounge™ websites and our TradingLounge™ Membership has been prepared without considering your objectives, financial situation or needs. Reliance on such advice, information or data is at your own risk. The decision to trade and the method of trading is for you alone to decide. This information is of a general nature only, so you should, before acting upon any of the information or advice provided by us, consider the appropriateness of the advice considering your own objectives, financial situation or needs. Therefore, you should consult your financial advisor or accountant to determine whether trading in securities and derivatives products is appropriate for you considering your financial circumstances.
Recommended content
Editors’ Picks

EUR/USD holds steady above 1.0500 ahead of FOMC Minutes
EUR/USD trades marginally higher on the day above 1.0500. The US Dollar struggles to preserve its strength amid a modest improvement seen in risk sentiment, helping EUR/USD hold its ground before the Fed publishes the minutes of the November policy meeting.

GBP/USD extends recovery, trades near 1.2600
GBP/USD extends its daily recovery toward 1.2600 in the European session on Tuesday, following a slump to the 1.2500 area in Asian trading. The pair finds footing as the US Dollar retreats with markets looking past Trump tariff threats, bracing for FOMC Minutes.

Gold price defends $2,600 ahead of FOMC minutes; not out of the woods yet
Gold price retains its negative bias for the second straight day but manages to hold comfortably above $2,600. The growing conviction that Donald Trump's expansionary policies will reignite inflation and limit the scope for the Fed to cut interest rates further triggers a fresh leg up in the US Treasury bond yields.

Trump shakes up markets again with “day one” tariff threats against CA, MX, CN
Pres-elect Trump reprised the ability from his first term to change the course of markets with a single post – this time from his Truth Social network; Threatening 25% tariffs "on Day One" against Mexico and Canada, and an additional 10% against China.

Eurozone PMI sounds the alarm about growth once more
The composite PMI dropped from 50 to 48.1, once more stressing growth concerns for the eurozone. Hard data has actually come in better than expected recently – so ahead of the December meeting, the ECB has to figure out whether this is the PMI crying wolf or whether it should take this signal seriously. We think it’s the latter.

Best Forex Brokers with Low Spreads
VERIFIED Low spreads are crucial for reducing trading costs. Explore top Forex brokers offering competitive spreads and high leverage. Compare options for EUR/USD, GBP/USD, USD/JPY, and Gold.