|

Texas Instruments Inc. (TXN) Elliott Wave technical analysis [Video]

TXN Elliott Wave Analysis Trading Lounge.

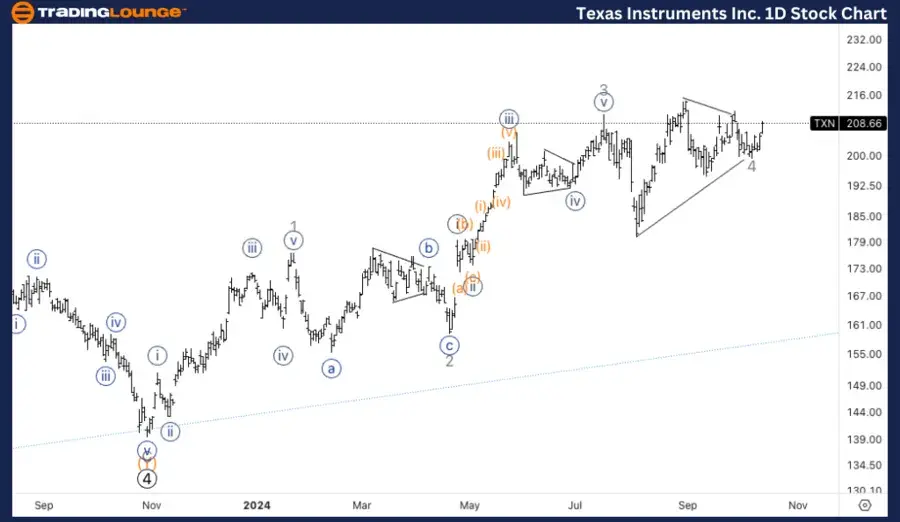
Texas Instruments Inc. (TXN) Daily Chart.

TXN Elliott Wave technical analysis

  • Function: Trend.

  • Mode: Impulsive.

  • Structure: Motive.

  • Position: Wave 4.

  • Direction: Upside in wave 5.

Details:

The chart suggests that TXN is currently in the final stages of a triangle pattern within wave 4. As wave 3 previously achieved equality with wave 1, an extension in wave 5 is anticipated. The breakout from this triangle formation is expected to push the price higher, marking the beginning of wave 5.

Chart

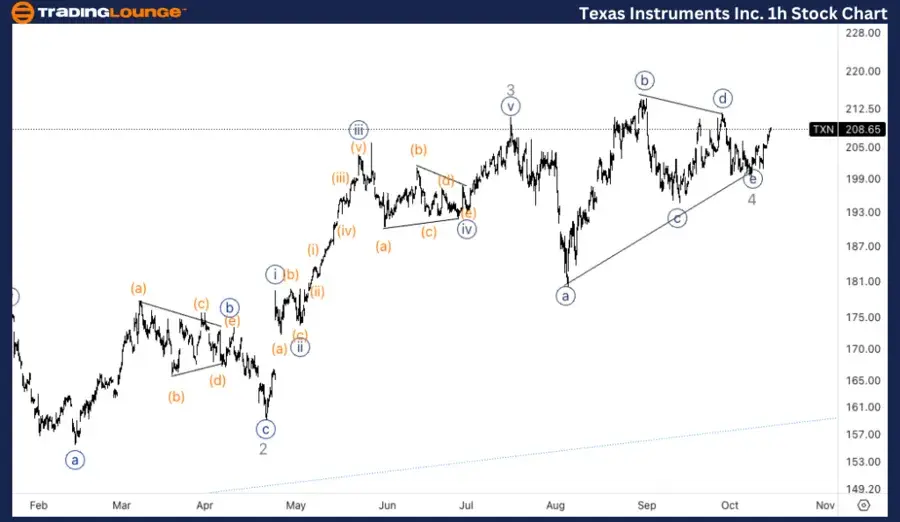
Texas Instruments Inc. (TXN) 1H Chart.

TXN Elliott Wave technical analysis

  • Function: Trend.

  • Mode: Impulsive.

  • Structure: Motive.

  • Position: Bottom in wave {e}.

  • Direction: Upside in wave {i}.

Details:

The 1-hour chart suggests that TXN has likely completed its correction with wave {e} marking the end of wave 4. The price is now advancing within wave {i}, specifically in wave (iii) of {i}, indicating a resumption of upward momentum. This movement signifies the beginning of the expected wave 5 rally.

Chart

Overview of TXN’s Elliott Wave analysis

In this Elliott Wave analysis, both the daily and 1-hour charts suggest an ongoing bullish trend for Texas Instruments Inc. (TXN).

Key Insights from the daily chart:

  • Wave 4 is forming a triangle pattern, indicating a consolidation phase.

  • A breakout into wave 5 is expected, potentially driving the price higher.

  • Wave 3's equality with wave 1 implies a possible extension in the upcoming wave 5.

Key Insights from the one-hour chart:

  • The correction appears to have completed with wave {e}.

  • The price is advancing in wave {i}, specifically within wave (iii) of {i}, suggesting renewed upward momentum.

  • This movement signals the early phase of the wave 5 rally.

Technical analyst: Alessio Barretta.

TXN Elliott Wave technical analysis [Video]

Author

Peter Mathers

Peter Mathers

TradingLounge

Peter Mathers started actively trading in 1982. He began his career at Hoei and Shoin, a Japanese futures trading company.

More from Peter Mathers
Share:

Editor's Picks

EUR/USD holds firm near 1.1850 amid USD weakness

EUR/USD remains strongly bid around 1.1850 in European trading on Monday. The USD/JPY slide-led broad US Dollar weakness helps the pair build on Friday's recovery ahead of the Eurozone Sentix Investor Confidence data for February. 

GBP/USD hovers near 1.3600 as UK government crisis weighs on Pound Sterling

GBP/USD moves sideways after registering modest gains in the previous session, trading around 1.3610 during the European hours on Monday. The pair could come under pressure as the Pound Sterling may weaken amid a fresh government crisis in the United Kingdom.

Gold remains supported by China's buying and USD weakness as traders eye US data

Gold struggles to capitalize on its intraday move up and remains below the $5,100 mark heading into the European session amid mixed cues. Data released over the weekend showed that the People's Bank of China extended its buying spree for a 15th month in January. Moreover, dovish US Fed expectations and concerns about the central bank's independence drag the US Dollar lower for the second straight day, providing an additional boost to the non-yielding yellow metal.

Cardano steadies as whale selling caps recovery

Cardano (ADA) steadies at $0.27 at the time of writing on Monday after slipping more than 5% in the previous week. On-chain data indicate a bearish trend, with certain whales offloading ADA. However, the technical outlook suggests bearish momentum is weakening, raising the possibility of a short-term relief rebound if buying interest picks up.

Japanese PM Takaichi nabs unprecedented victory – US data eyed this week

I do not think I would be exaggerating to say that Japanese Prime Minister Sanae Takaichi’s snap general election gamble paid off over the weekend – and then some. This secured the Liberal Democratic Party (LDP) an unprecedented mandate just three months into her tenure.

Bitcoin, Ethereum and Ripple consolidate after massive sell-off

Bitcoin, Ethereum, and Ripple prices consolidated on Monday after correcting by nearly 9%, 8%, and 10% in the previous week, respectively. BTC is hovering around $70,000, while ETH and XRP are facing rejection at key levels. Traders should be cautious: despite recent stabilization, upside recovery for these top three cryptocurrencies is capped as the broader trend remains bearish.