|

Texas Instruments Inc.(TXN) Elliott Wave technical analysis [Video]

Texas Instruments Inc., (TXN) Daily Chart

TXN Elliott Wave technical analysis

Function: Trend.

Mode: Impulsive.

Structure: Motive.

Position: Minute {iii} or 3.

Direction: Upside in {iii}.

Details: Moving as expected, looking for at least equality of 3 vs 1, as we could turn into an ABC and many times equality of C vs. A is a common target.

TXN Elliott Wave technical analysis – Daily chart

Texas Instruments (TXN) is moving as expected within the impulsive wave structure. We are looking for at least equality of wave 3 vs. wave 1. This movement could potentially turn into an ABC pattern, as equality of wave C vs. wave A is a common target in corrective waves.

Texas

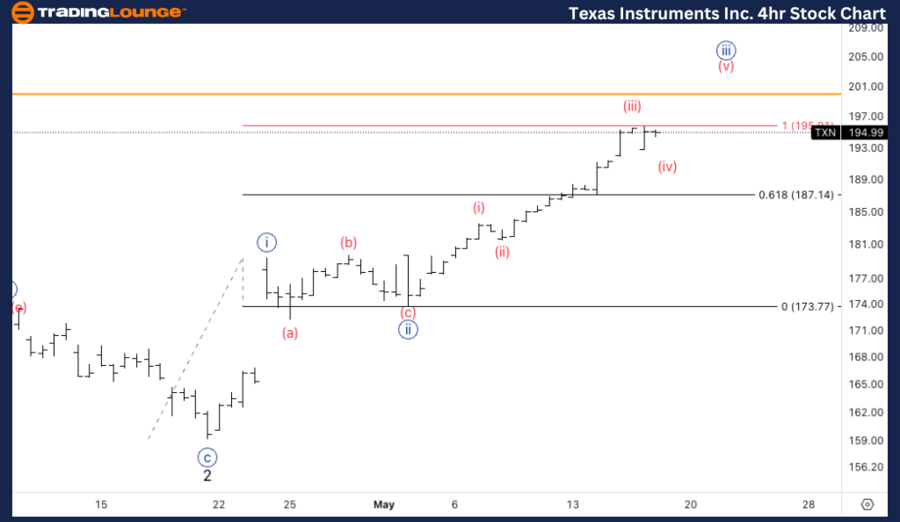
TXN Elliott Wave four-hour chart

In the 4-hour chart, TXN is progressing within wave (v) of {iii}. Currently, the stock is at the equality level of wave {iii} vs. wave {i}. We are looking for this equality to turn into a support level, which would further confirm the bullish trend.

Function: Trend.

Mode: Impulsive.

Structure: Motive.

Position: Minute (iii) of {iii}.

Direction: Upside in {iii}.

Details: Looking for upside into wave (v) of {iii}, we seem to be at equality of {iii] vs. {i}, looking for equality to turn into support.

Chart

Discover the latest Elliott Wave analysis for Texas Instruments (TXN) as of May 17, 2024. Learn about key support and resistance levels, and potential price targets for TXN stock.

TXN Elliott Wave technical analysis [Video]

Author

Peter Mathers

Peter Mathers

TradingLounge

Peter Mathers started actively trading in 1982. He began his career at Hoei and Shoin, a Japanese futures trading company.

More from Peter Mathers
Share:

Editor's Picks

EUR/USD holds firm near 1.1850 amid USD weakness

EUR/USD remains strongly bid around 1.1850 in European trading on Monday. The USD/JPY slide-led broad US Dollar weakness helps the pair build on Friday's recovery ahead of the Eurozone Sentix Investor Confidence data for February. 

GBP/USD hovers near 1.3600 as UK government crisis weighs on Pound Sterling

GBP/USD moves sideways after registering modest gains in the previous session, trading around 1.3610 during the European hours on Monday. The pair could come under pressure as the Pound Sterling may weaken amid a fresh government crisis in the United Kingdom.

Gold remains supported by China's buying and USD weakness as traders eye US data

Gold struggles to capitalize on its intraday move up and remains below the $5,100 mark heading into the European session amid mixed cues. Data released over the weekend showed that the People's Bank of China extended its buying spree for a 15th month in January. Moreover, dovish US Fed expectations and concerns about the central bank's independence drag the US Dollar lower for the second straight day, providing an additional boost to the non-yielding yellow metal.

Cardano steadies as whale selling caps recovery

Cardano (ADA) steadies at $0.27 at the time of writing on Monday after slipping more than 5% in the previous week. On-chain data indicate a bearish trend, with certain whales offloading ADA. However, the technical outlook suggests bearish momentum is weakening, raising the possibility of a short-term relief rebound if buying interest picks up.

Japanese PM Takaichi nabs unprecedented victory – US data eyed this week

I do not think I would be exaggerating to say that Japanese Prime Minister Sanae Takaichi’s snap general election gamble paid off over the weekend – and then some. This secured the Liberal Democratic Party (LDP) an unprecedented mandate just three months into her tenure.

Bitcoin, Ethereum and Ripple consolidate after massive sell-off

Bitcoin, Ethereum, and Ripple prices consolidated on Monday after correcting by nearly 9%, 8%, and 10% in the previous week, respectively. BTC is hovering around $70,000, while ETH and XRP are facing rejection at key levels. Traders should be cautious: despite recent stabilization, upside recovery for these top three cryptocurrencies is capped as the broader trend remains bearish.