Texas Instruments Inc.(TXN) Elliott Wave technical analysis [Video]
![Texas Instruments Inc.(TXN) Elliott Wave technical analysis [Video]](https://editorial.fxstreet.com/images/Markets/Equities/Industries/Pharma/vaccine-development_XtraLarge.jpg)
TXN Elliott Wave technical analysis
Function: Trend.
Mode: Impulsive.
Structure: Motive.
Position: Intermediate (1).
Direction: Acceleration in wave 3.
Ddetails: Looking for upside in wave 3 as we seem to have had a shallow wave {c} of 2, potentially indicating a strong upward momentum.
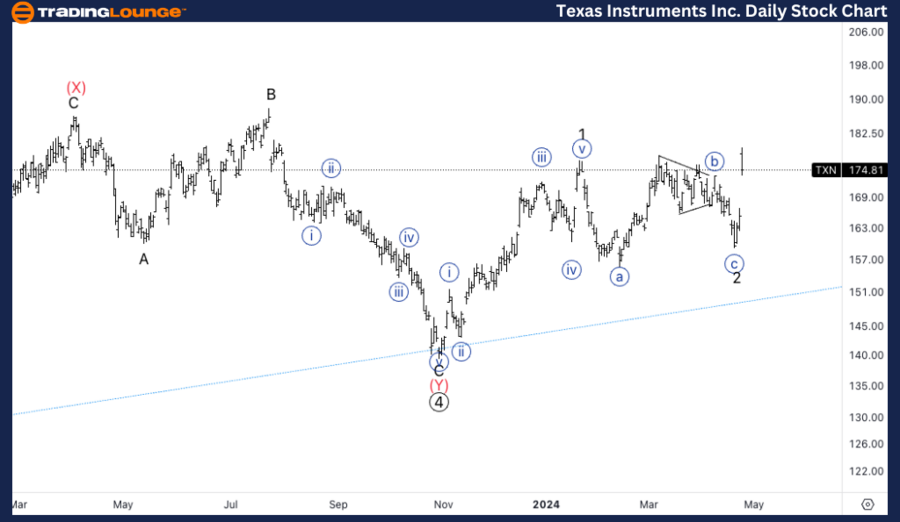
TXN Elliott Wave technical analysis – Daily chart
Texas Instruments Inc. is currently exhibiting a strong impulsive trend, characterized by a motive structure placed in Intermediate wave (1). The stock is anticipated to experience acceleration in wave 3 following a shallow wave {c} of 2. This suggests a robust upward momentum, signaling favorable conditions for bullish positions.
TXN Elliott Wave technical analysis
Function: Trend.
Mode: Impulsive.
Structure: Motive.
Position: Wave {i} of 3.
Direction: Top in wave {i}.
Details: Looking for a pullback in wave {ii} as we top in wave {i} to then look for additional longs, looking for 172$ to provide support.
We conducted a detailed Elliott Wave analysis for Texas Instruments Inc. (Ticker: TXN), examining both its daily and 4-hour chart movements. This analysis aims to provide valuable insights into potential future price movements for traders and investors interested in TXN stock.
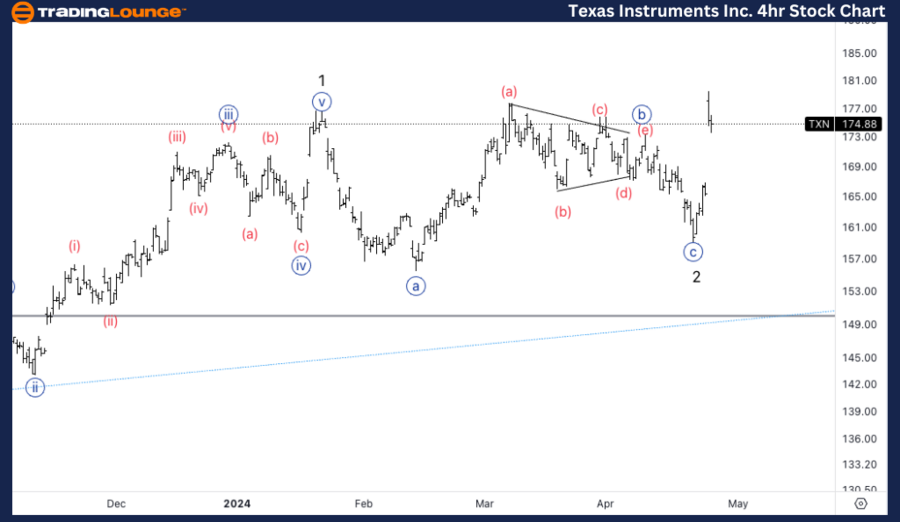
TXN Elliott Wave technical analysis – Four-hour chart
On the 4-hour chart, TXN's impulsive trend is further evident, with the stock positioned in Wave {i} of 3. As the stock approaches the top in wave {i}, a pullback is expected in wave {ii}. This corrective phase presents an opportunity for traders to consider additional long positions, with the key support level identified around $172.
TXN Elliott Wave technical analysis [Video]
Author

Peter Mathers
TradingLounge
Peter Mathers started actively trading in 1982. He began his career at Hoei and Shoin, a Japanese futures trading company.


