Tesla Stock Price and Forecast: Why is TSLA trending lower?
- Tesla shares continue to act in a sideways manner with little direction.
- TSLA stock aims to test 200-day moving average.
- Tesla releases results on Monday, July 26.

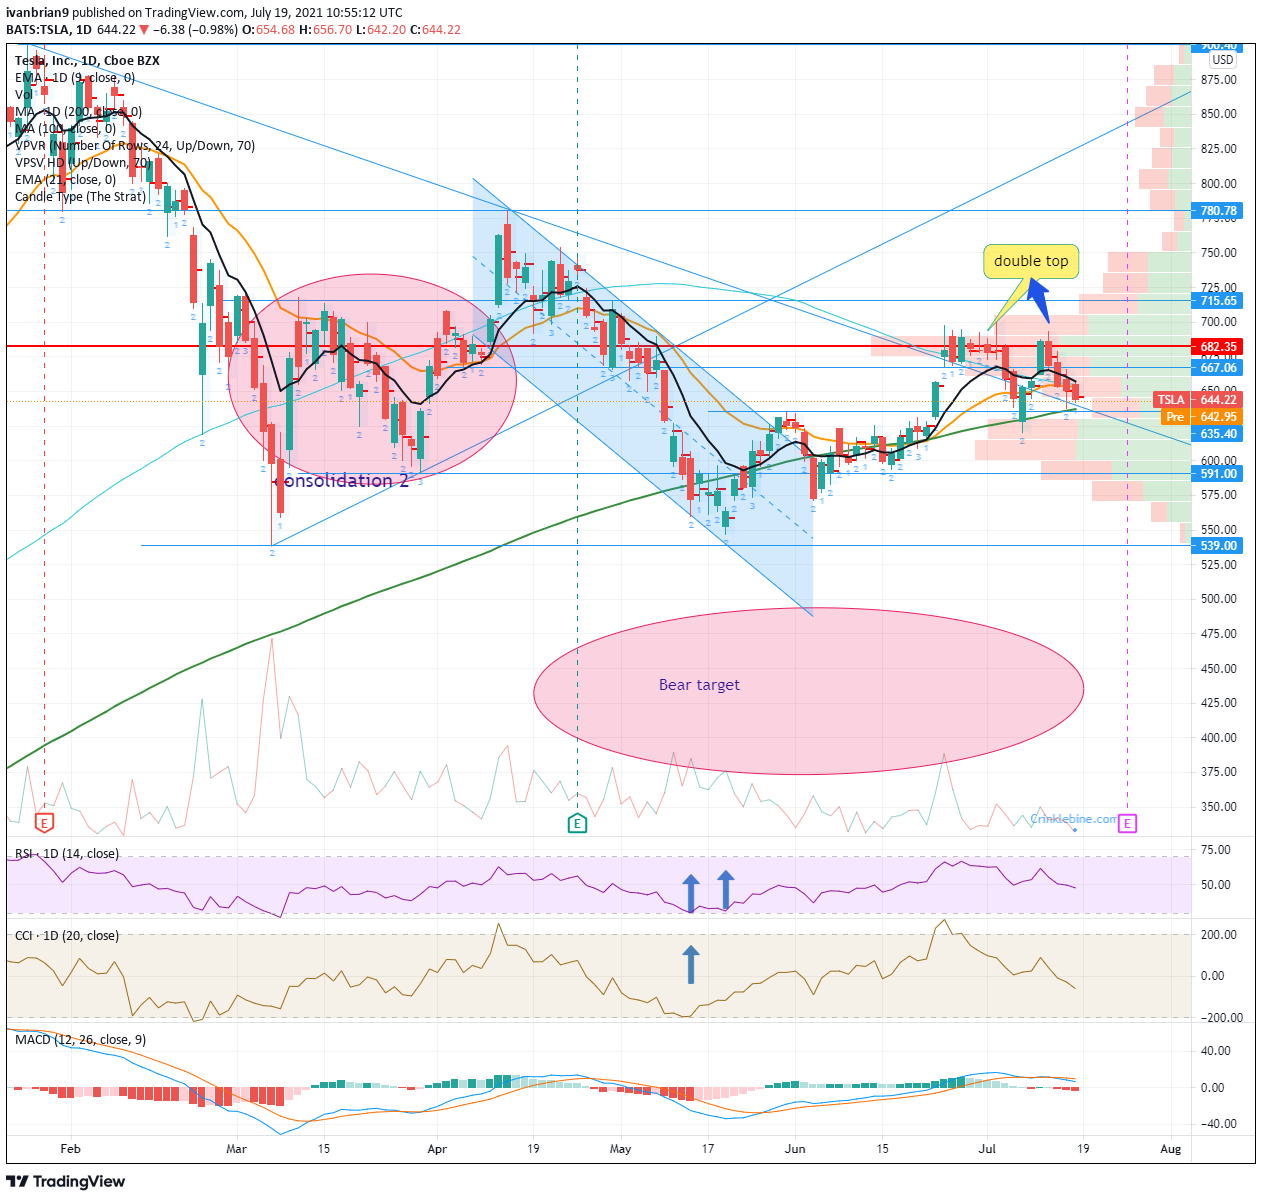
Tesla stock continues to show little direction and is stuck in a largely sideways range. This was exactly as FXStreet had been calling earlier in June when some powerful moves occurred, breaking some key levels. First, we identified the break above $635 and how the lack of volume could have seen it gather momentum, exactly as happened. Thereafter, Tesla targeted the next resistance at $667, but FXStreet had identified that from $667 to $715 Tesla would run into a lot of heavy volume traffic and further gains would be more difficult. This is what panned out as Tesla stock really struggled to even test the psychological $700 level. In the process, we have now put in a bearish double top just under $700 leading to the retracement back to the 200-day moving average. Added to this recent run of bearishness is the broader market starting to turn lower, meaning further headwinds for Tesla.
Tesla key statistics
| Market Cap | $620 billion |
| Price/Earnings | 651 |
| Price/Sales | 22 |
| Price/Book | 28 |
| Enterprise Value | $753 billion |
| Gross Margin | 0.21 |
| Net Margin |
0.03 |
| Average Wall Street Rating and Price Target | Hold, $657 |
Tesla stock forecast
Tesla is now trading below two of the key metrics for short-term position trading, the 9 and 21-day moving averages. These give us a directional clue to the trend. When below, both clearly show the short-term trend is negative. Making life even more difficult for the short-term position trader (rather than a Buffet-like investor) is the fact that both moving averages are in a sideways formation, meaning a strong trend is not in play. This means taking short-term positions is more difficult, with little risk-reward.
What we can see from the chart is a small double top in place just under $700. Tesla (TSLA) stock tested and failed and is now testing the 200-day moving average. This has so far held, and from the volume profile it is no surprise why. There is a lot of volume from $640 down to $600, so this is a strong support zone. Adding in the 200-day moving average only further adds to the support.
In my personal view, there is not a lot to do at current levels. There is just too much price chop. Generally, in a choppy range traders end up buying and selling multiple times for little gain. Even with good risk management, all those transactions mean commissions eat into your account. Better to wait for a clear signal, and right now I do not see one. Breaking the 200-day, while significant for many stocks, is not enough here. The volume is too high, and we can see previously in June how the 200-day was an area of considerable choppiness. Better to wait for a break of $591 as the lack of volume beneath here should see a price acceleration. Support would then come in at $546 from the May low and $539 from the March low. Until then results next week on Monday, July 26, will give beter directional clues. Buying a put with a strike under $590 could benefit from an acceleration in price due to lack of volume. The same can also be said with regard to buying a $715 or higher call. Volume is light above. Earnings may push the price in one of these directions.
Like this article? Help us with some feedback by answering this survey:
Premium
You have reached your limit of 3 free articles for this month.
Start your subscription and get access to all our original articles.
Author

Ivan Brian
FXStreet
Ivan Brian started his career with AIB Bank in corporate finance and then worked for seven years at Baxter. He started as a macro analyst before becoming Head of Research and then CFO.


