Tesla (TSLA) Stock Price and Forecast: Tesla has support at $539 as Bitcoin hurts
- Tesla shares continue to fall as Bitcoin investment hurts.
- TSLA sentiment worsens, but oversold RSI may give some hope for a bounce.
- TSLA shares have support at $539 as a pit stop.

Tesla shares continue their march lower post the Q1 2021 earnings release. The results were not bad, but the manner of the revenue generation is what investors worried over. Tesla gained significant revenue from environmental credits and trading in Bitcoin, not core to its business model and not what investors want to see. They want revenue to come from increasing margins and sales.
Further pressure was heaped on Tesla with the most recent sales numbers from China also disappointing investor expectations.
Many investors are also now wondering if Tesla has poked the bear, so to speak, and may end up being a victim of its own success. All legacy carmakers have announced plans to commit to a fully electric future. The majority of legacy auto manufacturers have targeted 2030 for this transition. While Tesla pioneered the whole electric vehicle sector it faces huge competition from legacy automakers going forward.
While many seem to take pleasure in the demise of Tesla's share price it should be noted that in 2020 Tesla appreciated by 743%. A slight pullback is therefore not to be unexpected.
Stay up to speed with hot stocks' news!
Tesla (TSLA) stock forecast
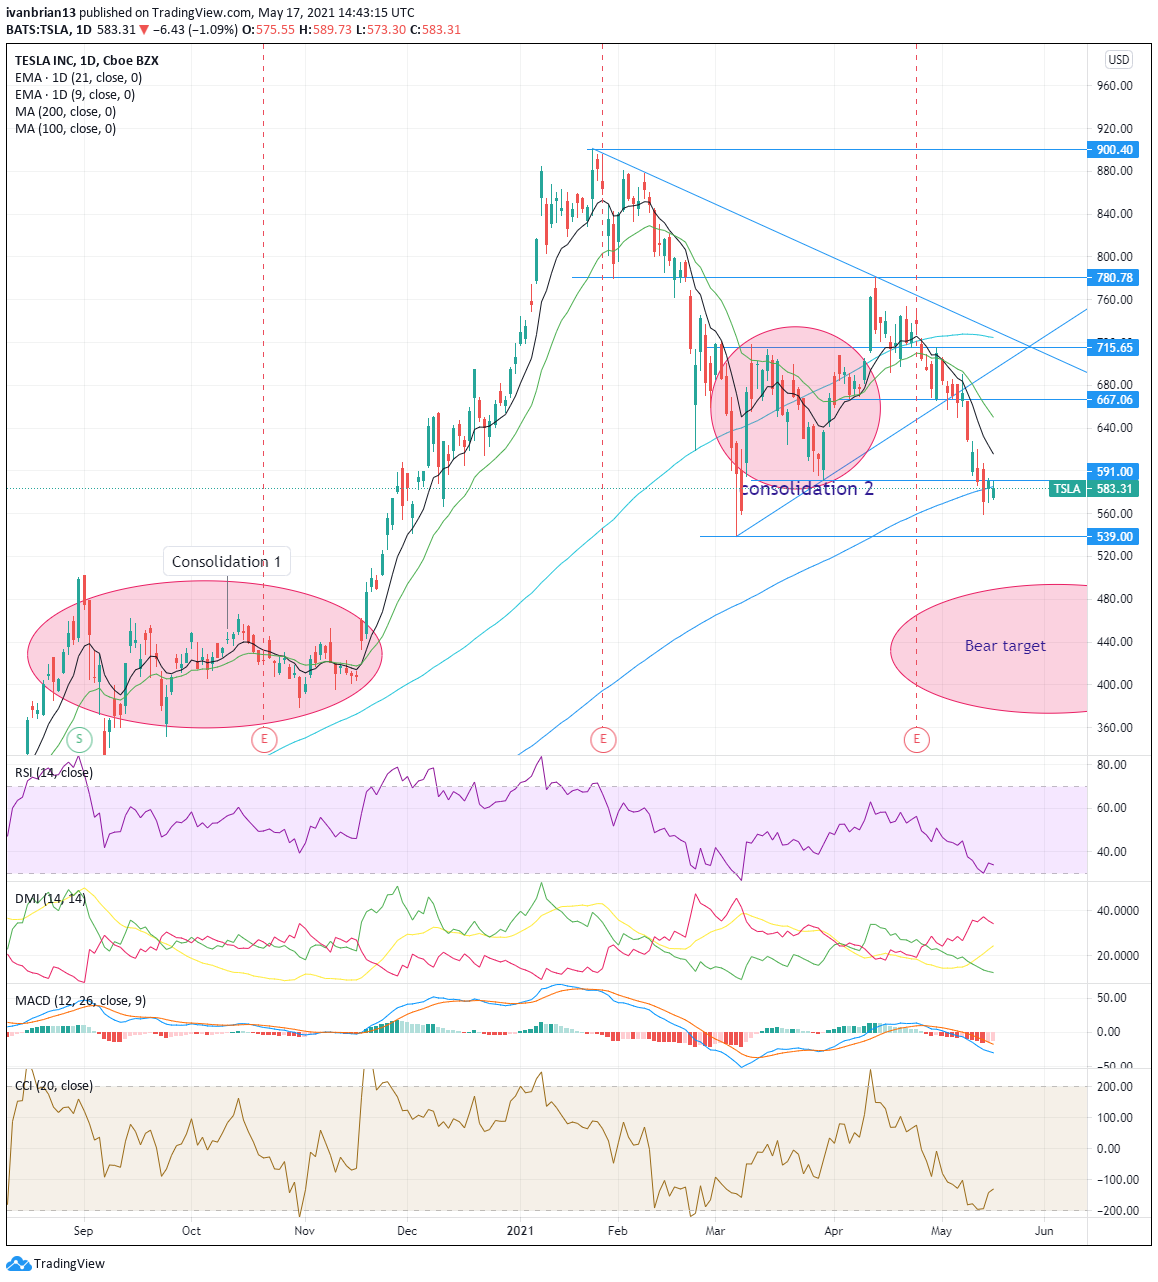
Tesla is currently trending toward support below $500 with a pit stop at $539 on the way. Friday's price action was strong though with a 3% gain. The key level to hold is clearly the well-watched 200-day moving average at $584. A break of this and it is down to $539 and then sub $500. For now, that still looks the most likely outcome as the trend remains firmly bearish. Early indications from the first hour of Monday's trading are that Tesla is again under pressure and has broken this $584 200-day moving average.
Some respite though was seen on Thursday, as both the RSI and CCI signaled oversold levels, and Tesla duly obliged with Friday's rally. Both of these indicators have now moved back to neutral levels. In order for Friday's rally to continue, Tesla needs to break $624, the 9-day moving average. But only on a break of $667 does the bearishness, that has engulfed Tesla since April, firmly end.
$539 remains the first target and then a test of the sub-$500 consolidation 1 area identified on the chart. This is a pretty decent support zone. A long period of price consolidations in the middle of a strong upward move.
MACD and DMI remain crossed into bearish territory.
| Support | 539 | 500 | 465 | 430 | ||
| Resistance | 584 | 591 | 667 bullish | 715 | 781 | 900 |
At the time of writing, the author has no position in any stock mentioned in this article and no business relationship with any company mentioned. The author has not received compensation for writing this article, other than from FXStreet.
This article is for information purposes only. The author and FXStreet are not registered investment advisors and nothing in this article is intended to be investment advice. It is important to perform your own research before making any investment and take independent advice from a registered investment advisor.
FXStreet and the author do not provide personalized recommendations. The author makes no representations as to accuracy, completeness, or the suitability of this information. FXStreet and the author will not be liable for any errors, omissions or any losses, injuries or damages arising from this information and its display or use. The author will not be held responsible for information that is found at the end of links posted on this page.
Errors and omissions excepted.
Premium
You have reached your limit of 3 free articles for this month.
Start your subscription and get access to all our original articles.
Author

Ivan Brian
FXStreet
Ivan Brian started his career with AIB Bank in corporate finance and then worked for seven years at Baxter. He started as a macro analyst before becoming Head of Research and then CFO.


