- Tesla stock collapses by over 11% on Tuesday.
- TSLA shares under pressure after Elon Musk tweets about selling.
- TSLA loses $140 billion in market cap on Tuesday.
A huge collapse in the share price of Tesla makes it possibly the largest one-day loss in market cap ever. Meta (FB), formerly Facebook, has had a few large losses as have other mega tech names like Apple (AAPL), but from our brief look through the numbers, we cannot see a greater single-day loss of market cap than this one yesterday. Admittedly, it has to do with Tesla's (TSLA) enormous valuation, making a fall of 11% huge in real numbers. While 11% is a hefty fall anyway in percentage terms, there has been a lot worse.
Tesla closed Tuesday at $1023.50 for a loss of 11.99%.
-637721359238180268.png)
Tesla graph 15 minute
Tesla (TSLA) stock news
The move is now well established as Elon Musk had tweeted about selling 10% of his holding. Given he is the founder and CEO, this is a significant amount. Even noted Tesla bull Ross Gerber said, "We do feel the stock has moved up substantially in the short term and is probably over-valued by about 20 percent so... for long term investors this isn’t a bad time to rebalance by any means."-Reuters. Some recent selling by insiders also will have been noted. Elon Musk's brother Kimbal filed to sell nearly $100 million worth of stock, adding to recent sales by board member Ira Ehrenpreis and former board member Antonio Gracias. Kimbal Musk also donated 25,000 Tesla shares to charity.
Tesla (TSLA) stock forecast
Now the chart looks ugly, very ugly. Even with a loss like the one on Monday, the stock is still well ahead for 2021. Tesla (TSLA) is still outperforming the indices as it is ahead by 45% year to date and 150% from this time last year. The move on Monday retraced to the 21-day moving average. Resistance is now at the 9-day MA at $1,120, but given the uncertainty around the proposed share sale by Elon Musk, Tesla is unlikely to bounce this far. Tesla just about held the key psychological level of $1,000, and it will surely look to test that support this week.
We had been warnings that the stock was hugely overbought with a Relative Strength Index (RSI) reading over 90. Now that this has corrected, the RSI is back in neutral. The Moving Average Convergence Divergence (MACD) is about to cross into a bearish signal. The trend is now bearish for the short and medium term and means all bounces should be looked at as selling opportunites. Please always use stops.
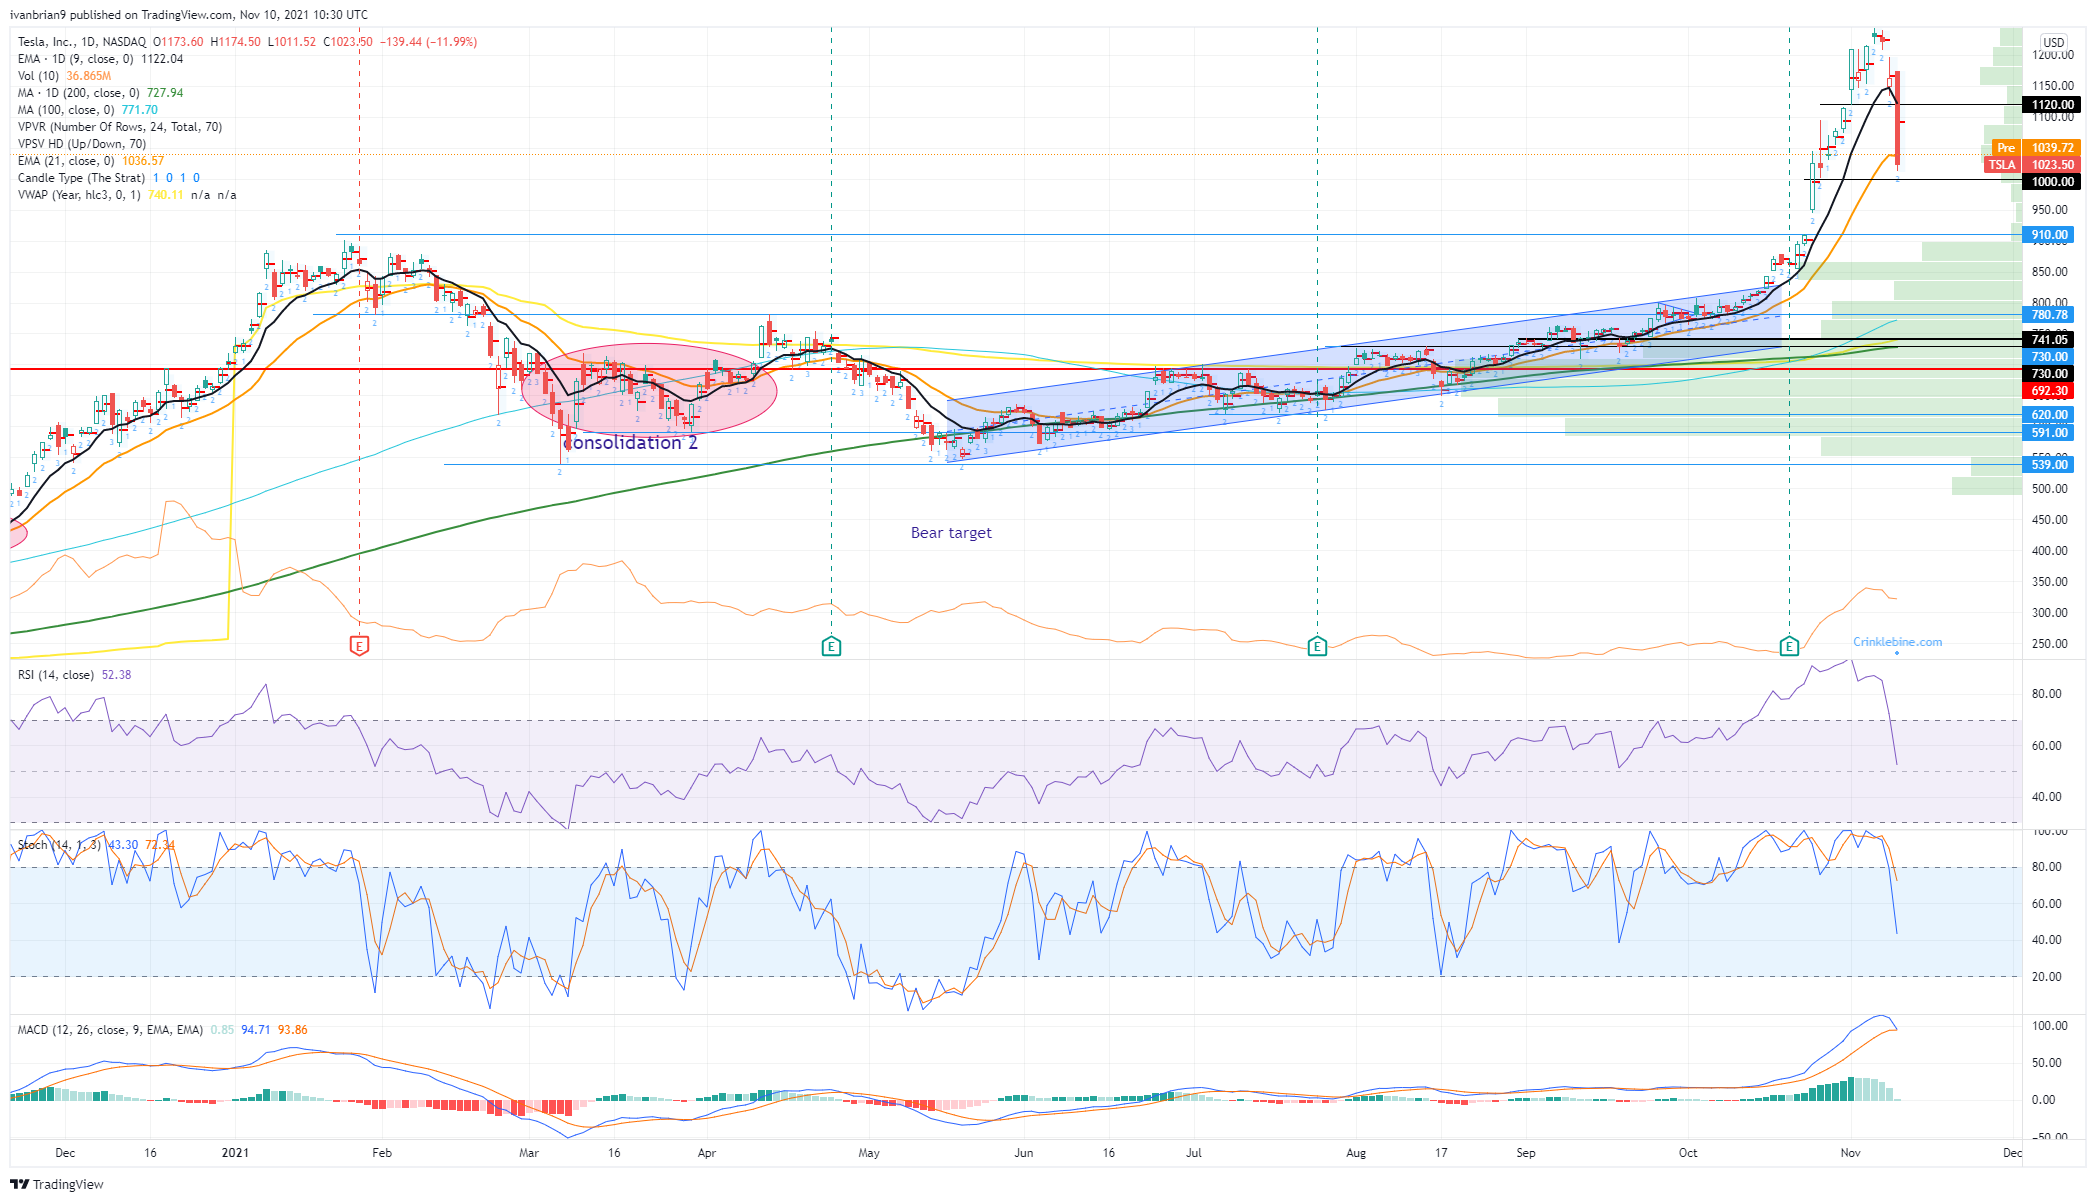
TSLA 1-day chart
Information on these pages contains forward-looking statements that involve risks and uncertainties. Markets and instruments profiled on this page are for informational purposes only and should not in any way come across as a recommendation to buy or sell in these assets. You should do your own thorough research before making any investment decisions. FXStreet does not in any way guarantee that this information is free from mistakes, errors, or material misstatements. It also does not guarantee that this information is of a timely nature. Investing in Open Markets involves a great deal of risk, including the loss of all or a portion of your investment, as well as emotional distress. All risks, losses and costs associated with investing, including total loss of principal, are your responsibility. The views and opinions expressed in this article are those of the authors and do not necessarily reflect the official policy or position of FXStreet nor its advertisers. The author will not be held responsible for information that is found at the end of links posted on this page.
If not otherwise explicitly mentioned in the body of the article, at the time of writing, the author has no position in any stock mentioned in this article and no business relationship with any company mentioned. The author has not received compensation for writing this article, other than from FXStreet.
FXStreet and the author do not provide personalized recommendations. The author makes no representations as to the accuracy, completeness, or suitability of this information. FXStreet and the author will not be liable for any errors, omissions or any losses, injuries or damages arising from this information and its display or use. Errors and omissions excepted.
The author and FXStreet are not registered investment advisors and nothing in this article is intended to be investment advice.


Recommended content
Editors’ Picks

EUR/USD bounces off lows, retests 1.1370
Following an early drop to the vicinity of 1.1310, EUR/USD now manages to regain pace and retargets the 1.1370-1.1380 band on the back of a tepid knee-jerk in the US Dollar, always amid growing optimism over a potential de-escalation in the US-China trade war.

GBP/USD trades slightly on the defensive in the low-1.3300s
GBP/USD remains under a mild selling pressure just above 1.3300 on Friday, despite firmer-than-expected UK Retail Sales. The pair is weighed down by a renewed buying interest in the Greenback, bolstered by fresh headlines suggesting a softening in the rhetoric surrounding the US-China trade conflict.

Gold remains offered below $3,300
Gold reversed Thursday’s rebound and slipped toward the $3,260 area per troy ounce at the end of the week in response to further improvement in the market sentiment, which was in turn underpinned by hopes of positive developments around the US-China trade crisis.

Ethereum: Accumulation addresses grab 1.11 million ETH as bullish momentum rises
Ethereum saw a 1% decline on Friday as sellers dominated exchange activity in the past 24 hours. Despite the recent selling, increased inflows into accumulation addresses and declining net taker volume show a gradual return of bullish momentum.

Week ahead: US GDP, inflation and jobs in focus amid tariff mess – BoJ meets
Barrage of US data to shed light on US economy as tariff war heats up. GDP, PCE inflation and nonfarm payrolls reports to headline the week. Bank of Japan to hold rates but may downgrade growth outlook. Eurozone and Australian CPI also on the agenda, Canadians go to the polls.

The Best brokers to trade EUR/USD
SPONSORED Discover the top brokers for trading EUR/USD in 2025. Our list features brokers with competitive spreads, fast execution, and powerful platforms. Whether you're a beginner or an expert, find the right partner to navigate the dynamic Forex market.