- Tesla stock continues its recent strong surge.
- The EV leader breaks above $780 resistance on strong volume in a down day for stocks.
- TSLA to have "most intense delivery week ever."
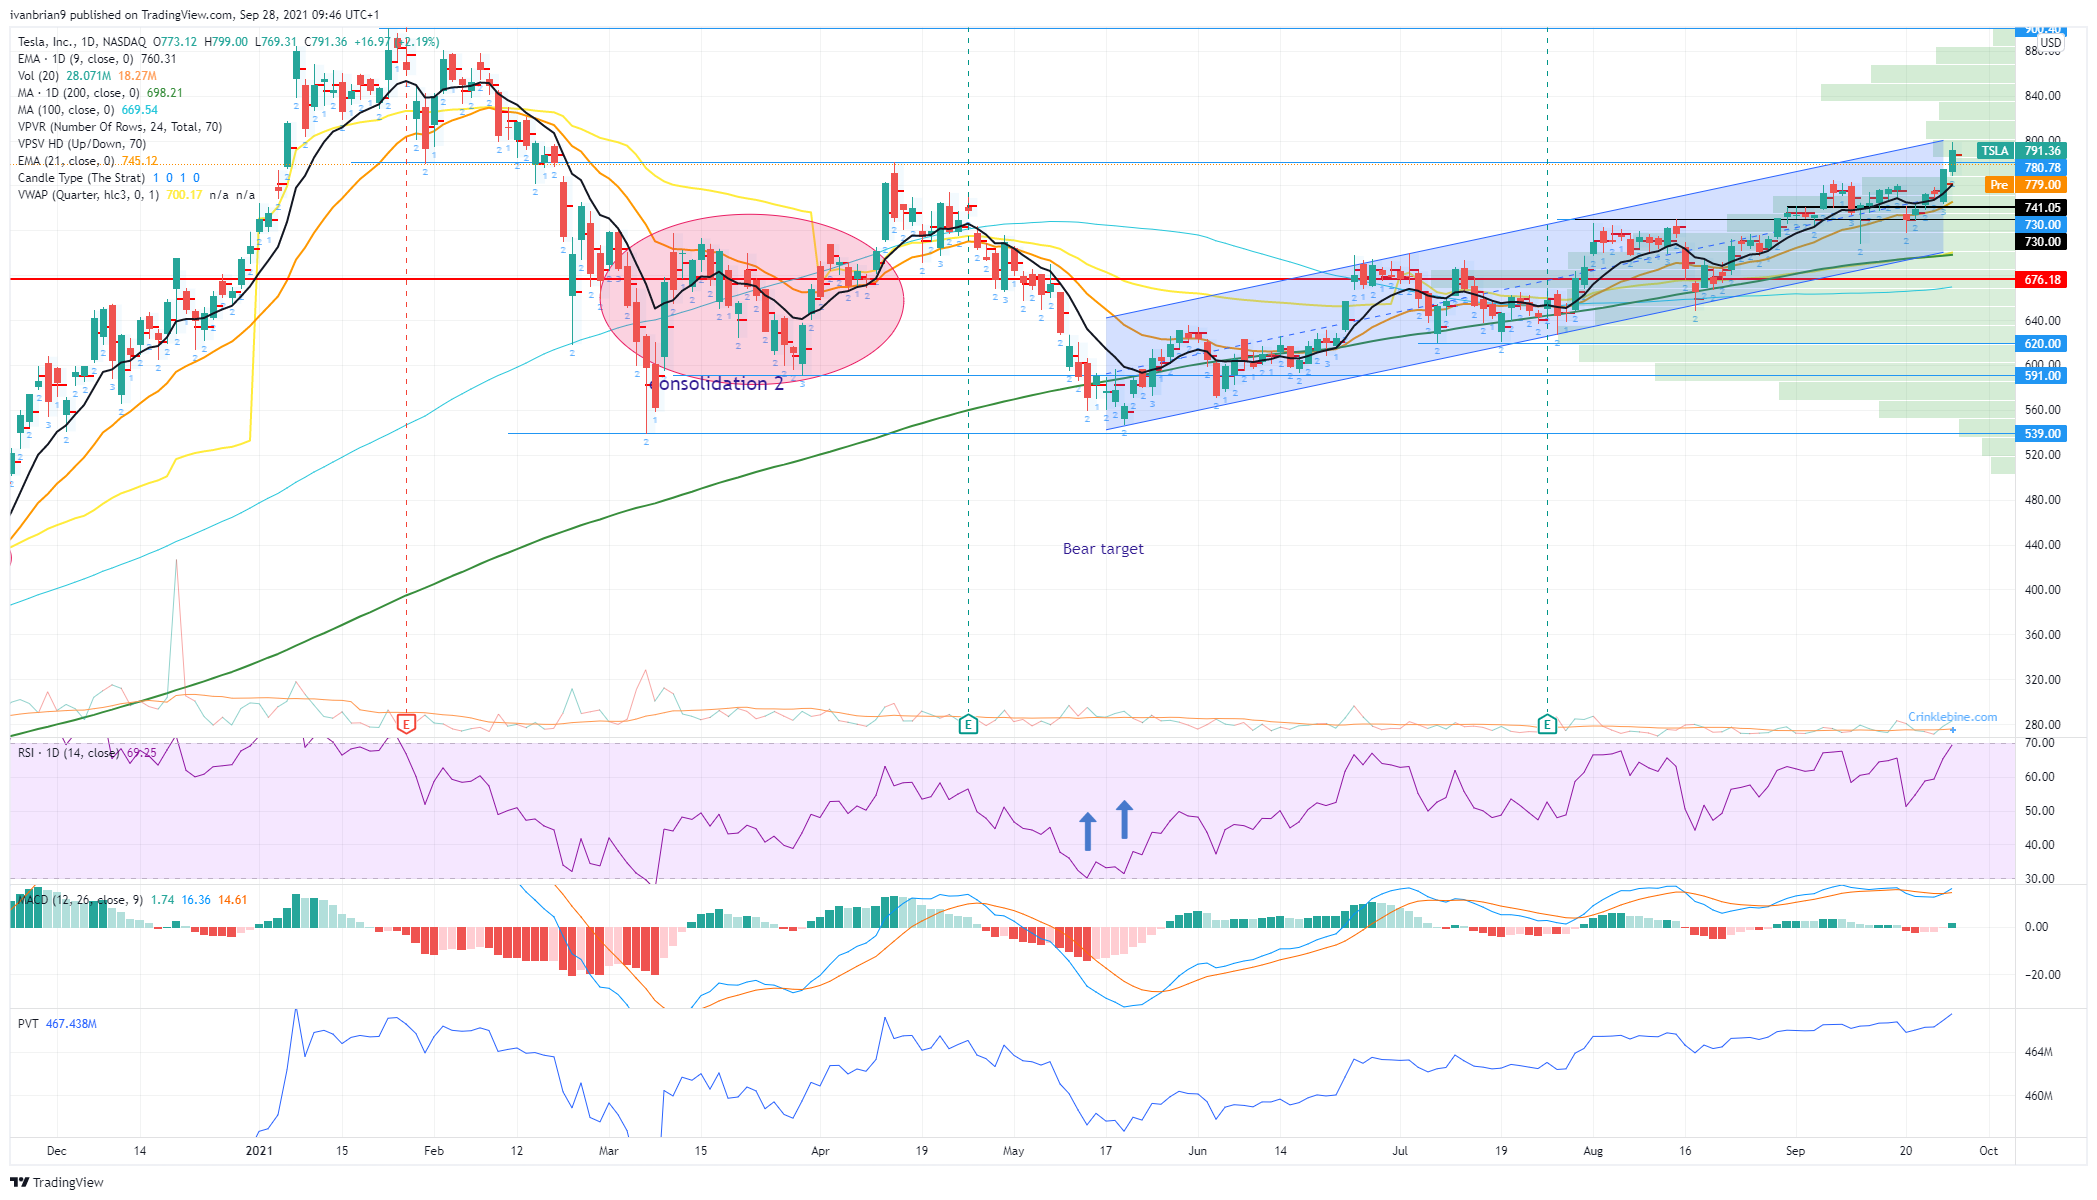
Tesla (TSLA) stock continues to drive higher and break key levels in the process. Thankfully, FXStreet has been guiding you higher along with the stock price and has seen some key technical levels serve their expected role and volume gaps working exactly as they are supposed to. Monday saw a particularly strong performance from Tesla as the overall market was lower and tech and Nasdaq stocks took a bath due to higher yields. Tesla stock though surged ahead by over 2% to close above the big $780 resistance at $791.36. This set a new high not seen since the middle of February this year.
-637684147798155897.png)
As we can clearly see from the 15-minute intraday chart above, this was a solid steady move from the open with TSLA stock closing near the high of the day.
Tesla key statistics
| Market Cap | $783 billion |
| Price/Earnings | 394 |
| Price/Sales | 23 |
| Price/Book | 29 |
| Enterprise Value | $756 billion |
| Gross Margin | 22% |
| Net Margin |
6% |
| 52-week high | $900.40 |
| 52-week low | $329.88 |
| Average Wall Street Rating and Price Target | Hold, $704 |
Tesla (TSLA) stock news
The main catalyst picked up on by traders appears to have been an email sent by Tesla CEO Elon Musk over the weekend. Electrek reported that the employee email flagged the "most intense delivery week ever." Delivery numbers are obviously closely watched by investors. Some caution must be heeded though as a report by Reuters suggests that supply chain issues are not going away as some Chinese suppliers to Tesla (TSLA) and Apple (AAPL) have been forced to temporarily halt production due to energy consumption policies.
Tesla (TSLA) stock forecast
The break above $780 was significant, and this will need to be consolidated upon. The news mentioned above about supply chain issues may be seized upon by bears, but so long as Tesla (TSLA) holds the $780 level, then the bullish move is still in control. The last two positive days have been confirmed by a crossover in the Moving Average Convergence Divergence (MACD) and a rising Price Volume Trend (PVT) indicator.
FXStreet View: Bullish above $780, neutral $780 to $730.
Information on these pages contains forward-looking statements that involve risks and uncertainties. Markets and instruments profiled on this page are for informational purposes only and should not in any way come across as a recommendation to buy or sell in these assets. You should do your own thorough research before making any investment decisions. FXStreet does not in any way guarantee that this information is free from mistakes, errors, or material misstatements. It also does not guarantee that this information is of a timely nature. Investing in Open Markets involves a great deal of risk, including the loss of all or a portion of your investment, as well as emotional distress. All risks, losses and costs associated with investing, including total loss of principal, are your responsibility. The views and opinions expressed in this article are those of the authors and do not necessarily reflect the official policy or position of FXStreet nor its advertisers. The author will not be held responsible for information that is found at the end of links posted on this page.
If not otherwise explicitly mentioned in the body of the article, at the time of writing, the author has no position in any stock mentioned in this article and no business relationship with any company mentioned. The author has not received compensation for writing this article, other than from FXStreet.
FXStreet and the author do not provide personalized recommendations. The author makes no representations as to the accuracy, completeness, or suitability of this information. FXStreet and the author will not be liable for any errors, omissions or any losses, injuries or damages arising from this information and its display or use. Errors and omissions excepted.
The author and FXStreet are not registered investment advisors and nothing in this article is intended to be investment advice.


Recommended content
Editors’ Picks

EUR/USD keeps the range bound trade near 1.1350
After bottoming near the 1.1300 level, EUR/USD has regained upward momentum, pushing toward the 1.1350 zone following the US Dollar’s vacillating price action. Meanwhile, market participants remain closely tuned to developments in the US-China trade war.

GBP/USD still well bid, still focused on 1.3200
The Greenback's current flattish stance lends extra support to GBP/USD, pushing the pair back to around the 1.3200 level as it reaches multi-day highs amid improved risk sentiment on Monday.

Gold trades with marked losses near $3,200
Gold seems to have met some daily contention around the $3,200 zone on Monday, coming under renewed downside pressure after hitting record highs near $3,250 earlier in the day, always amid alleviated trade concerns. Declining US yields, in the meantime, should keep the downside contained somehow.

Six Fundamentals for the Week: Tariffs, US Retail Sales and ECB stand out Premium
"Nobody is off the hook" – these words by US President Donald Trump keep markets focused on tariff policy. However, some hard data and the European Central Bank (ECB) decision will also keep things busy ahead of Good Friday.

Is a recession looming?
Wall Street skyrockets after Trump announces tariff delay. But gains remain limited as Trade War with China continues. Recession odds have eased, but investors remain fearful. The worst may not be over, deeper market wounds still possible.

The Best brokers to trade EUR/USD
SPONSORED Discover the top brokers for trading EUR/USD in 2025. Our list features brokers with competitive spreads, fast execution, and powerful platforms. Whether you're a beginner or an expert, find the right partner to navigate the dynamic Forex market.