Tesla (TSLA) Stock Price and Forecast: Perfect consolidation set up for a drive to $781
- Tesla stock consolidates above $700 after a strong end to last week.
- TSLA is on target to break $781 resistance.
- The EV giant is still one of the retail trader's favourite stocks.
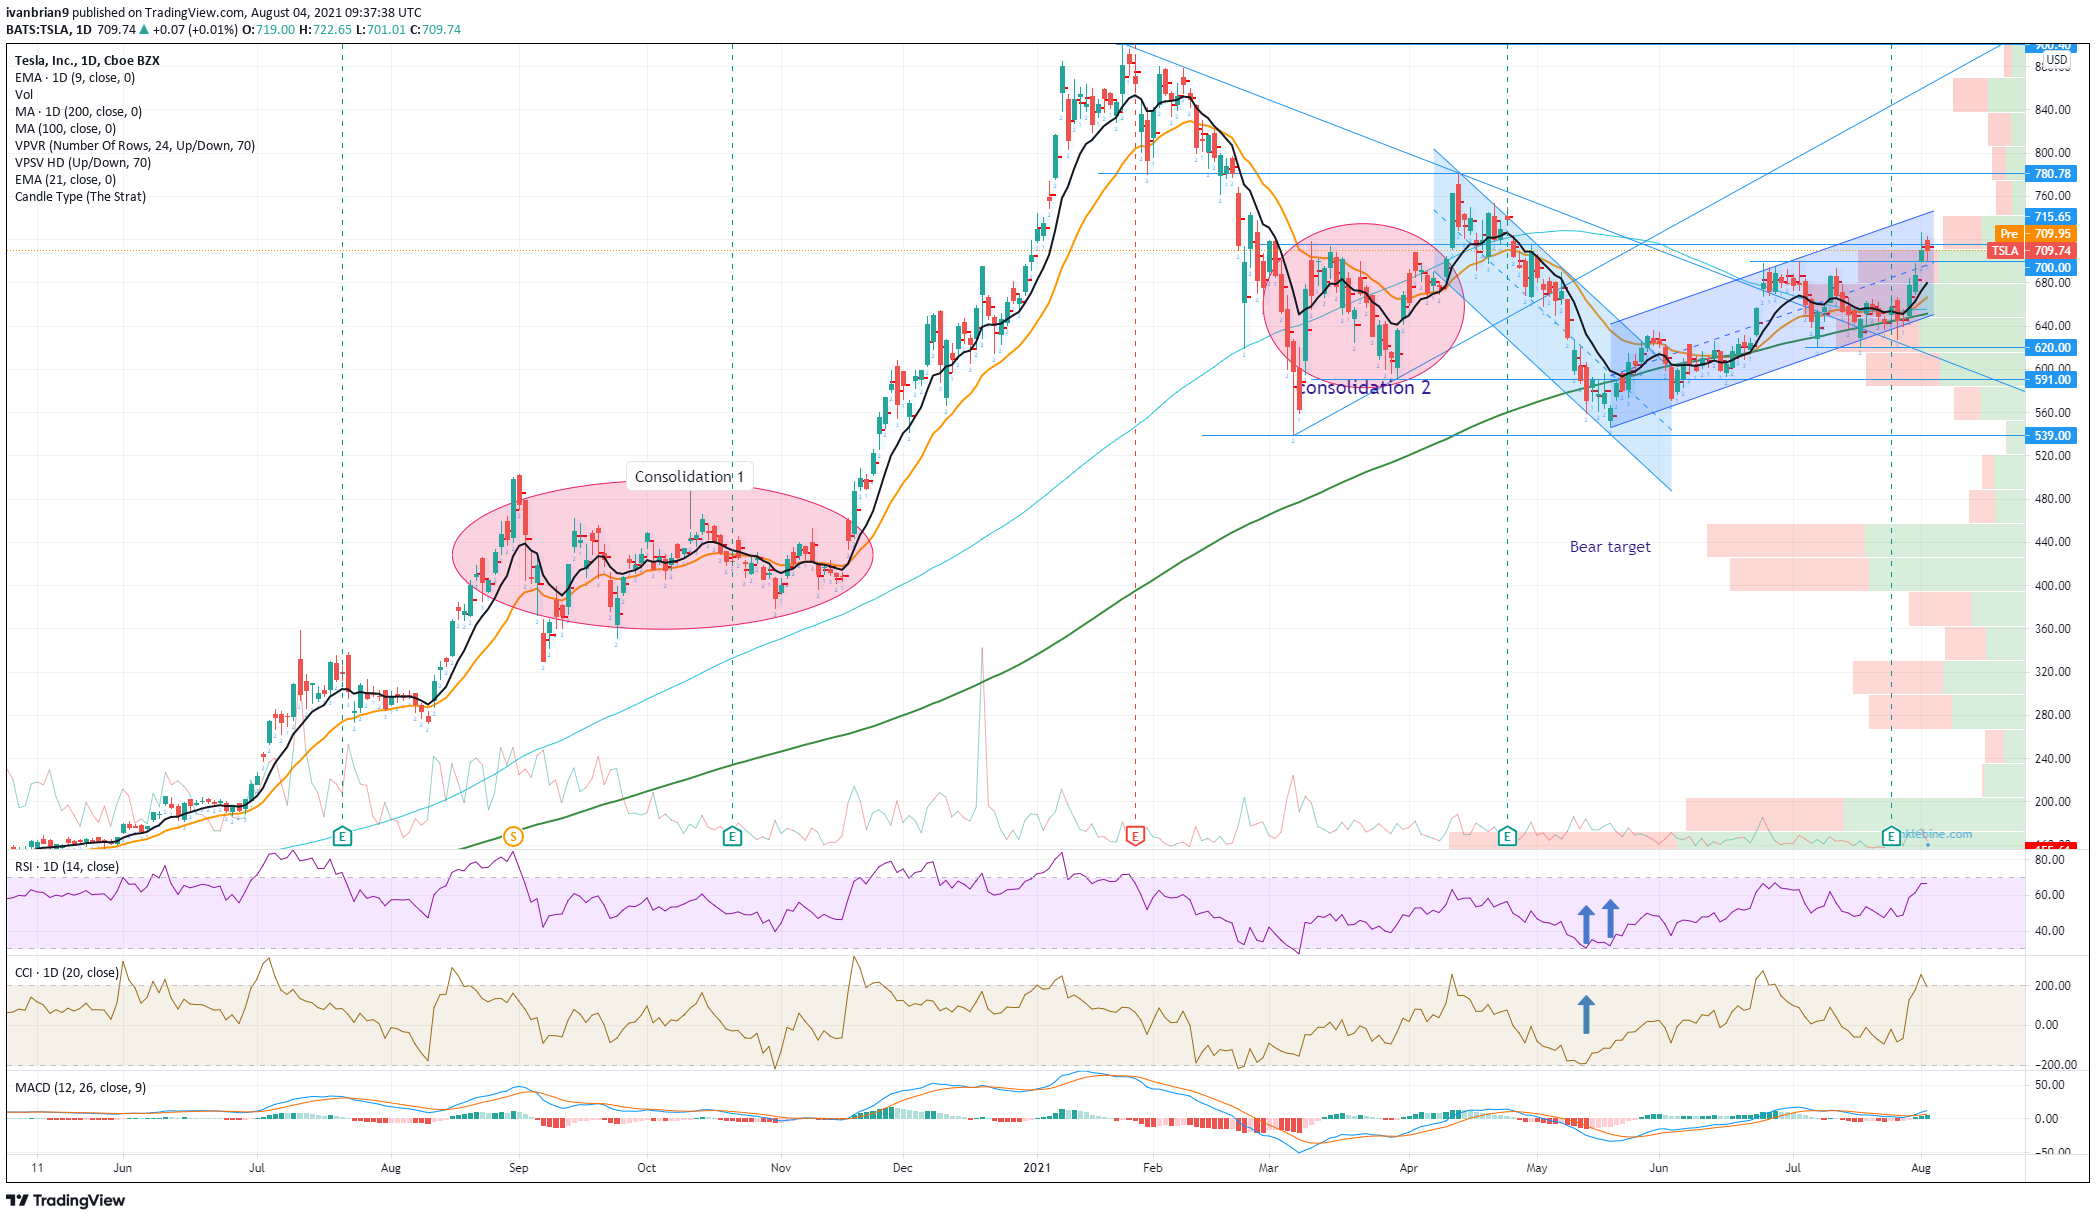
Tesla stock steadied itself for a test of higher levels on Tuesday, closing barely changed at $709.74. However, it was a perfect setup from a consolidation of the recent uptick, as the stock tested the psychological level at $700, with a low on Tuesday of $701.01. This keeps the bullish trend intact and Tesla remains on track to test our next resistance at $781, the high from April 14.
We had earlier last week made a call on some options trading, which worked out nicely with a quadrupling in the value in a matter of just two sessions. We were unsure if Tesla would break out higher or lower, but knew based on volume profile that any breakout should be sharp. Options can be used to profit even if you do not know the direction, but you can forecast some volatility. This has played out and now TSLA is still bullish, with the technical indicators so far showing further risk-reward to the upside.
-637636667112849604.png)
Tesla released results last week and, even though they were strong, the stock did not really react. Earnings were strong with a beat on the top and bottom lines. Adjusted earnings per share (EPS) came in at $1.45 versus the estimate from Wall Street analysts for $0.96. Sales came in at $11.96 billion, also beating the $11.21 billion estimate. Delivery numbers were also high on investors' minds, and these too were ahead of estimates. Tesla delivered 201,304 vehicles in Q2 2021, an increase of 121% over the same period last year.
Tesla said its average selling price had declined by 2% over the year, but its gross margin increased three percentage points from 25.4% to 28.4%. The move was more technical in nature with the psychological $700 resistance finally giving way. Next up, Tesla needs to break $715 to really get the move going with some further momentum as the volume profile –the volume at each price level– really dries up once through this level. The less volume, then the less resistance to the price moving quickly through.
Tesla key statistics
| Market Cap | $702 billion |
| Price/Earnings | 358 |
| Price/Sales | 23 |
| Price/Book | 29 |
| Enterprise Value | $753 billion |
| Gross Margin | 22% |
| Net Margin |
6% |
| Average Wall Street Rating and Price Target | Hold, $706 |
Tesla stock forecast
Any pullback to $697 where there is a tiny opening gap to fill is fine, so long as nothing lower gives way. This could be used as a pullback to enter some longs but use the 9-day moving average as a stop level. Otherwise, look for $715 to break and then the move to really charge up (pun intended!) with $781 as the next target and resistance. The Moving Average Convergence Divergence (MACD) has crossed over into bullish territory, confirming the move. The Relative Strength Index (RSI) and Commodity Channel Index CCI) have also trended higher, confirming the price.
Like this article? Help us with some feedback by answering this survey:
Premium
You have reached your limit of 3 free articles for this month.
Start your subscription and get access to all our original articles.
Author

Ivan Brian
FXStreet
Ivan Brian started his career with AIB Bank in corporate finance and then worked for seven years at Baxter. He started as a macro analyst before becoming Head of Research and then CFO.