In this technical article we’re going to take a quick look at the Elliott Wave charts of Tesla Stock ( $TSLA ) . As our members know, the stock is trading within the cycle from the April 27th low. We have been calling for the rally in the stock after 3 waves pull back. Our team recommended members to avoid selling Tesla, while keep favoring the long side. In the further text we are going to explain the Elliott Wave Forecast and the trading setup.

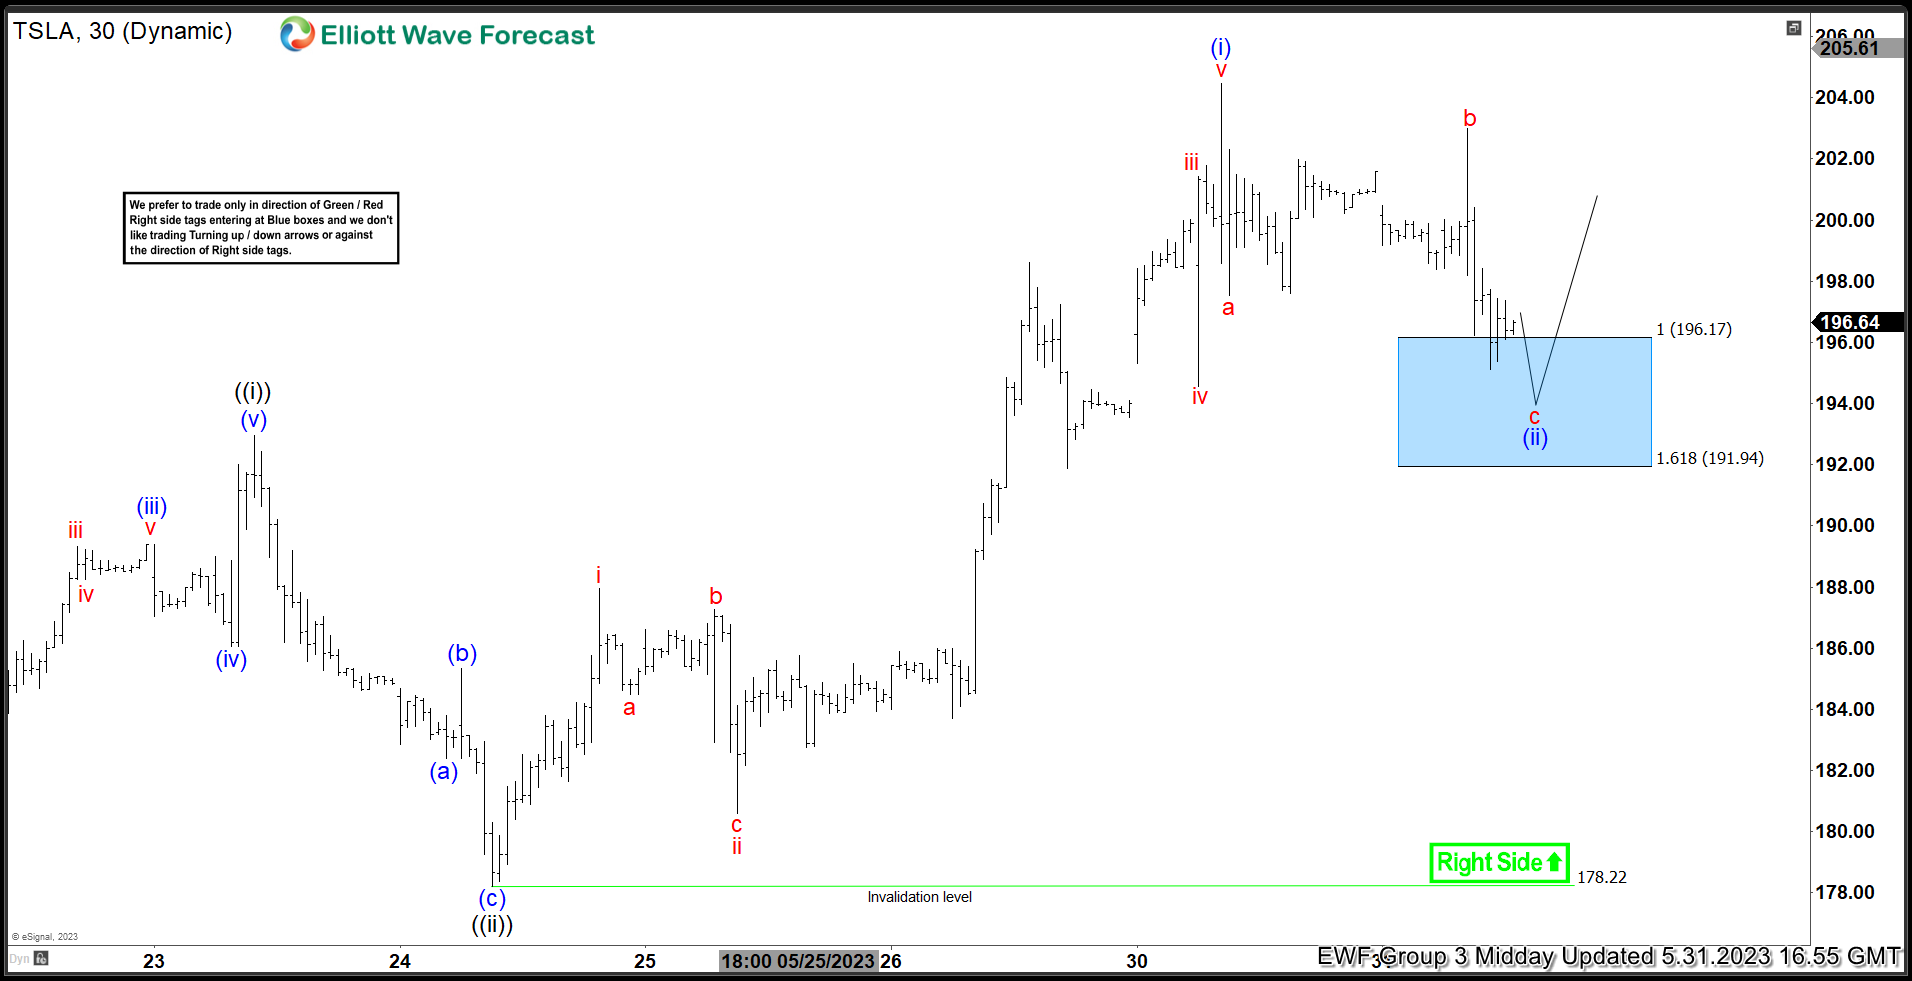
Tesla stock ($TSLA) Elliott Wave 1-hour chart 05.31.2023

Current view suggests the stock is doing correction of the cycle from the 178.22 low.  We got 5 waves up from the mentioned low wave  and now about to complete (ii) blue short term pull back.  We can already count 3 waves down from the peak. The price has reached extreme zone at 196.17-191.94 ( blue box- buying zone) . We don’t recommend selling it and prefer the long side.  Tesla stock should ideally make a rally toward new highs.

Chart

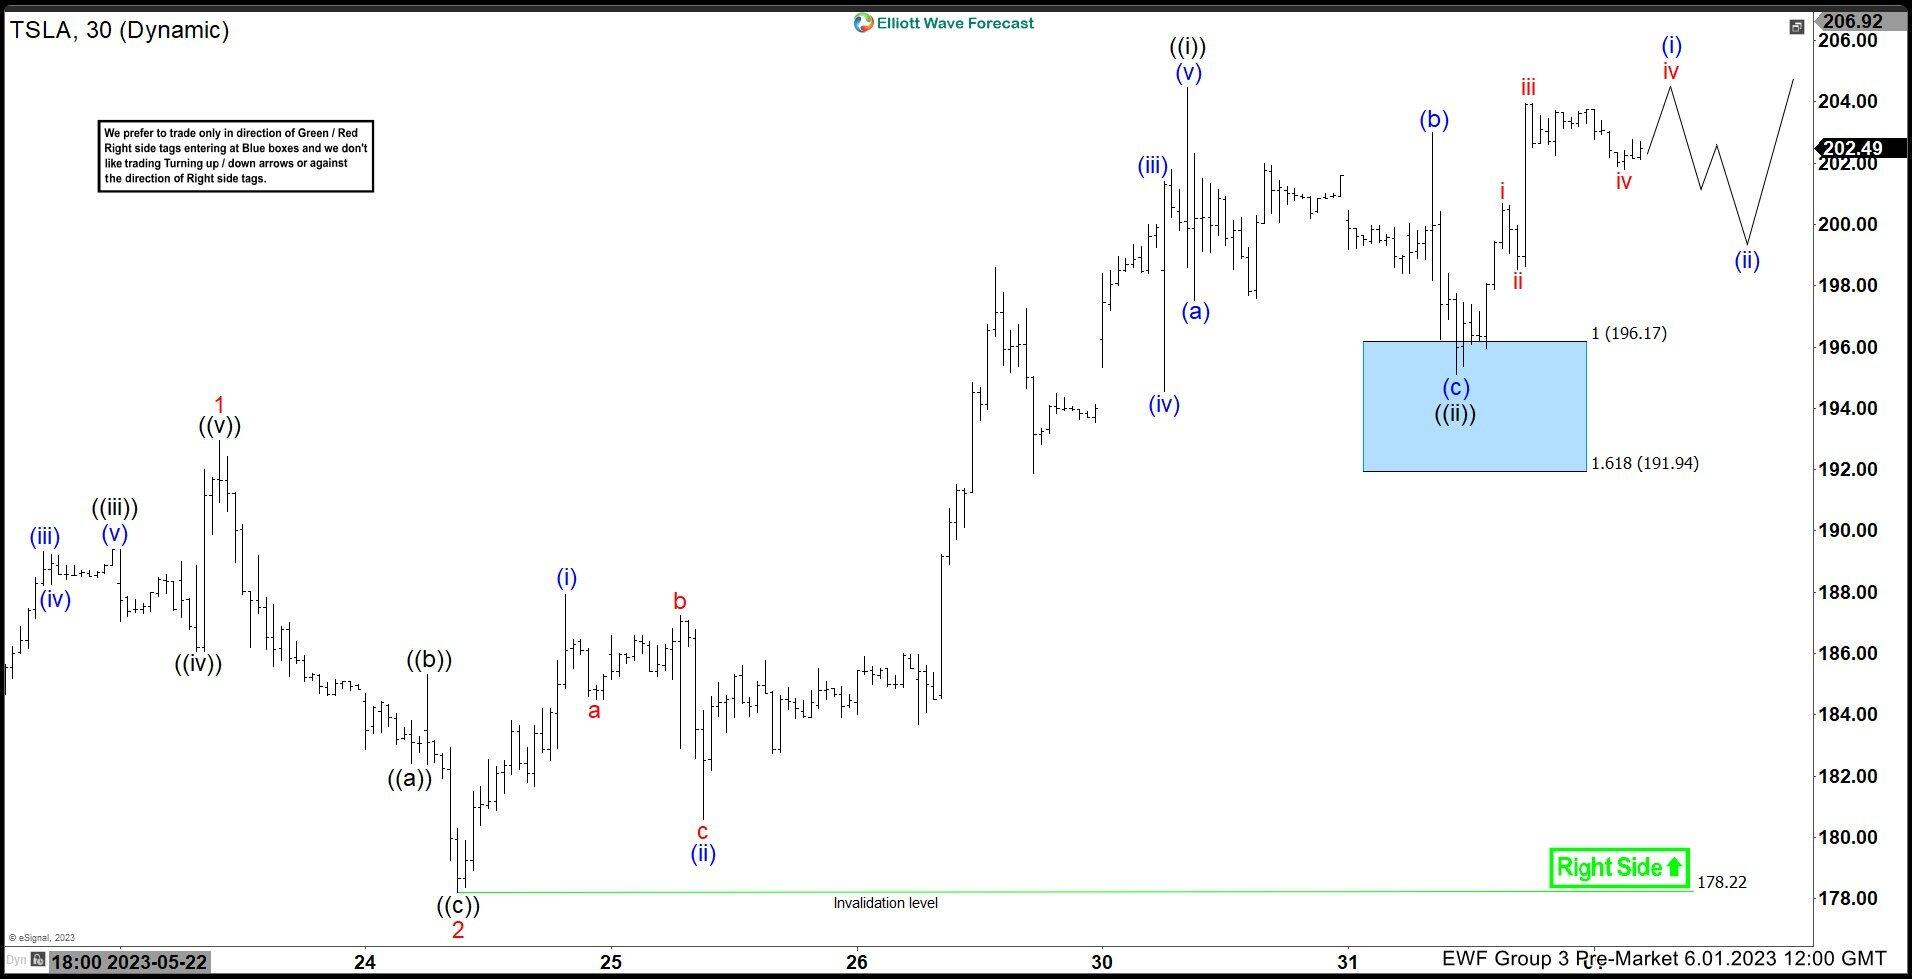
Tesla stock ($TSLA) Elliott Wave 1-hour chart 06.01.2023

$TSLA found buyers right at the Blue Box area and we are getting good reaction from there. Rally made enough separation from the lows.  As a result, members who took long positions are enjoying profits in a risk free trades. Wave ((ii)) looks completed at 195.17 low . As far as the price holds above that low, the stock can be trading higher in ((iii)) toward new highs. We would like to see break above previous peak ((i)) black which will confirm next leg up is in progress.  That would also make 5 waves up in (i) blue. Then we expect to get 3 waves pull back before further rally continues again.

Chart

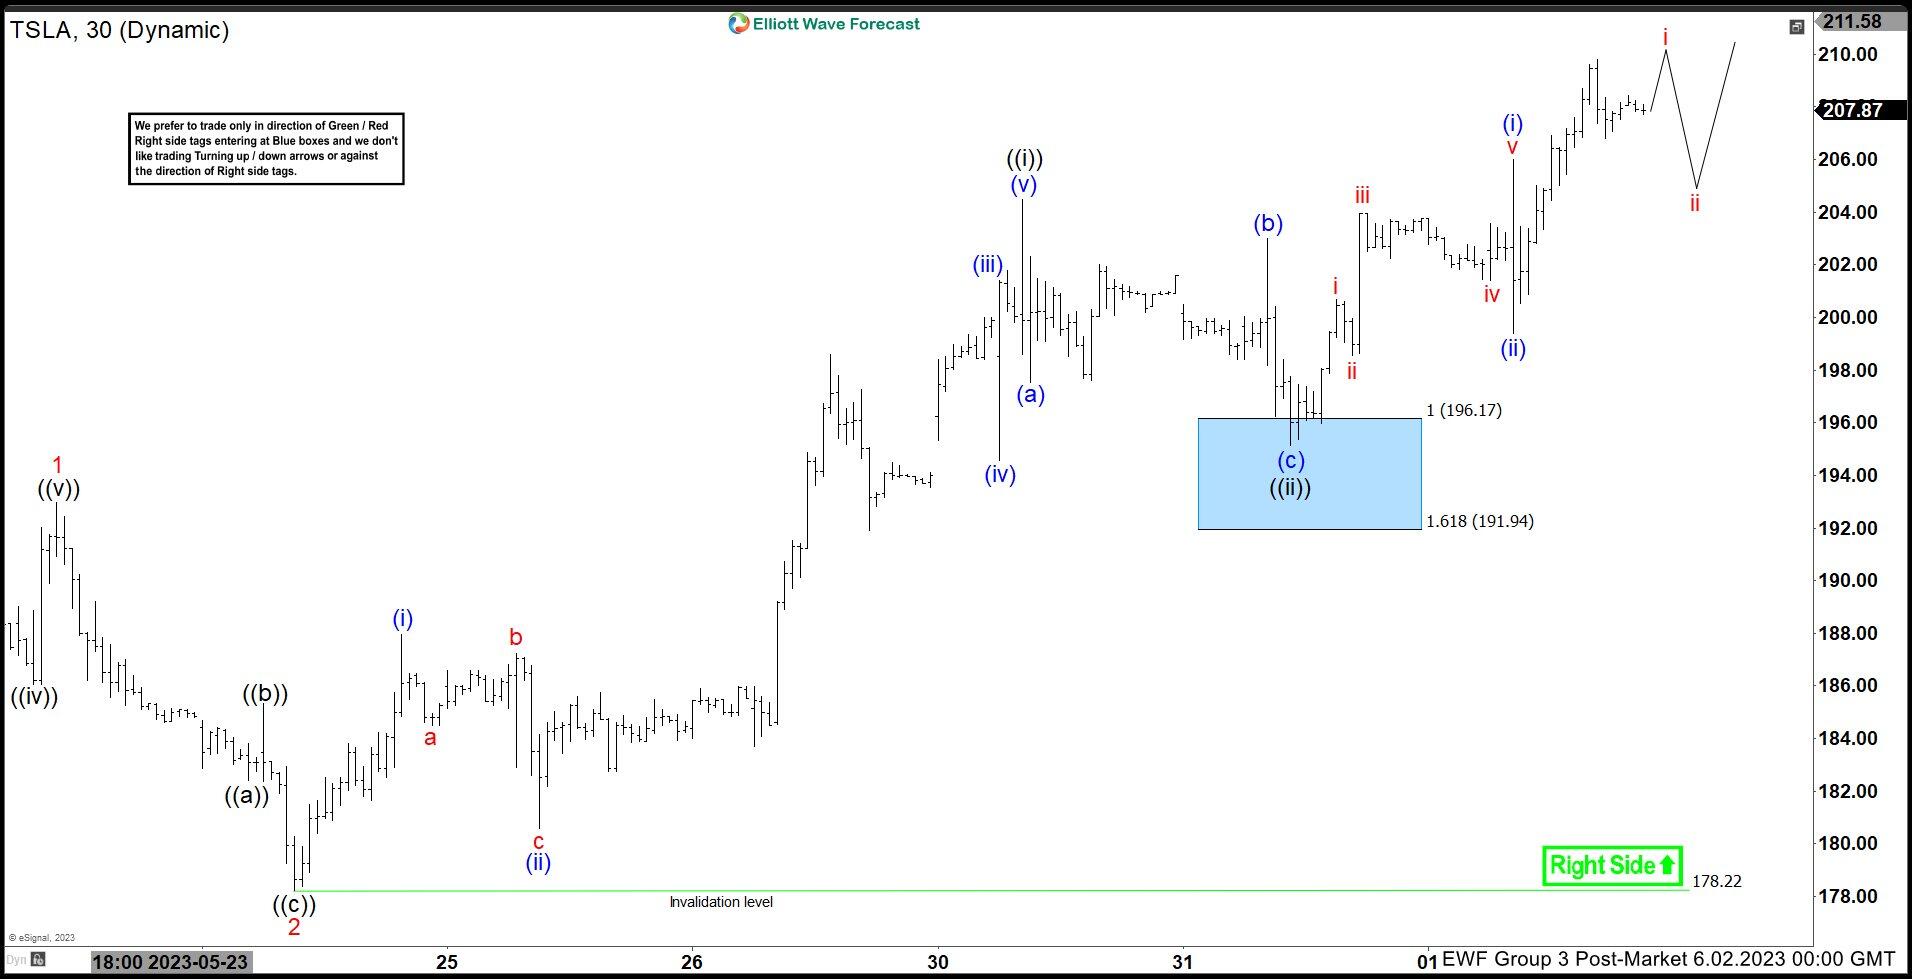
Tesla stock ($TSLA) Elliott Wave 1-hour chart 06.02.2023

Eventually the stock made break up as expected. It completed 5 waves up in (i) blue, made pull back in (ii) blue and continued higher again.

Chart

Share: Feed news

FURTHER DISCLOSURES AND DISCLAIMER CONCERNING RISK, RESPONSIBILITY AND LIABILITY Trading in the Foreign Exchange market is a challenging opportunity where above average returns are available for educated and experienced investors who are willing to take above average risk. However, before deciding to participate in Foreign Exchange (FX) trading, you should carefully consider your investment objectives, level of xperience and risk appetite. Do not invest or trade capital you cannot afford to lose. EME PROCESSING AND CONSULTING, LLC, THEIR REPRESENTATIVES, AND ANYONE WORKING FOR OR WITHIN WWW.ELLIOTTWAVE- FORECAST.COM is not responsible for any loss from any form of distributed advice, signal, analysis, or content. Again, we fully DISCLOSE to the Subscriber base that the Service as a whole, the individual Parties, Representatives, or owners shall not be liable to any and all Subscribers for any losses or damages as a result of any action taken by the Subscriber from any trade idea or signal posted on the website(s) distributed through any form of social-media, email, the website, and/or any other electronic, written, verbal, or future form of communication . All analysis, trading signals, trading recommendations, all charts, communicated interpretations of the wave counts, and all content from any media form produced by www.Elliottwave-forecast.com and/or the Representatives are solely the opinions and best efforts of the respective author(s). In general Forex instruments are highly leveraged, and traders can lose some or all of their initial margin funds. All content provided by www.Elliottwave-forecast.com is expressed in good faith and is intended to help Subscribers succeed in the marketplace, but it is never guaranteed. There is no “holy grail” to trading or forecasting the market and we are wrong sometimes like everyone else. Please understand and accept the risk involved when making any trading and/or investment decision. UNDERSTAND that all the content we provide is protected through copyright of EME PROCESSING AND CONSULTING, LLC. It is illegal to disseminate in any form of communication any part or all of our proprietary information without specific authorization. UNDERSTAND that you also agree to not allow persons that are not PAID SUBSCRIBERS to view any of the content not released publicly. IF YOU ARE FOUND TO BE IN VIOLATION OF THESE RESTRICTIONS you or your firm (as the Subscriber) will be charged fully with no discount for one year subscription to our Premium Plus Plan at $1,799.88 for EACH person or firm who received any of our content illegally through the respected intermediary’s (Subscriber in violation of terms) channel(s) of communication.

Recommended content


Recommended content

Editors’ Picks

AUD/USD finally broke above 0.6700… will it last?

AUD/USD finally broke above 0.6700… will it last?

AUD/USD added to Tuesday’s advance and rose markedly in a context favourable to the risk-associated space following the sharp data-driven sell-off in the Greenback, while auspicious results from the domestic calendar also lent legs to AUD.

AUD/USD News

EUR/USD: Bullish outlook expected above the 200-day SMA

EUR/USD: Bullish outlook expected above the 200-day SMA

EUR/USD extended its multi-session recovery north of 1.0800 the figure following the persistent retracement in the US Dollar and against the backdrop of steady expectation ahead of the second round of French elections on July 7.

EUR/USD News

Gold reaches $2,360 on broad USD weakness

Gold reaches $2,360 on broad USD weakness

Gold gathers bullish momentum and trades at its highest level in nearly two weeks above $2,360. Following the disappointing ADP Employment Change and ISM Services PMI data from the US, the 10-year US yield declines sharply, helping XAU/USD extend its daily rally.

Gold News

Ripple legal battle underway as on-chain metrics turn bullish, XRP eyes recovery to $0.50

Ripple legal battle underway as on-chain metrics turn bullish, XRP eyes recovery to $0.50

Ripple made a comeback above $0.48 on Tuesday and hovers above that level in Wednesday’s European session. Ripple on-chain metrics such as transaction volume and Network Realized Profit/Loss (NPL) have turned bullish, supporting a recovery in the altcoin. 

Read more

Disinflation in the United States: The scale of the sacrifice on the labour market

Disinflation in the United States: The scale of the sacrifice on the labour market

Since a 1977 act, the dual mandate of the Federal Reserve (Fed) has de jure entrusted it with the objectives of maximum employment and price stability (the latter being expected to favour the former in the long term).

Read more

Forex MAJORS

Cryptocurrencies

Signatures