- Tesla stock loses 3% on Thursday after the CPI number.
- High growth is not the sector to be in during this hawkish environment.
- Tesla will struggle with this macro backdrop.
Tesla (TSLA) stock lost 3% on Thursday after the US CPI report. The inflation reading was higher than expected and showed inflation broadening out to all sectors of the economy. Fed futures immediately priced in a near 80% chance of a 50bps rate hike at the next Fed meeting in March. In Friday's premarket, things have steadied somewhat with yields giving up some ground. VIX though has risen as investors grow increasingly nervous about the prospects for equities going forward.
Tesla Stock News
Tesla CEO Elon Musk did not help the macro focus when he reportedly said "something has got to give" on US national debt. We also see some news about Tesla looking to add a new design center in Beijing. Not too significant, per se, but it does underline just how important China is to many big tech firms.
Tesla obviously has its Shanghai gigfactory, and China is the world's largest electric vehicle market. China in 2021 represented over 50% of the world's electric vehicle sales. The macroeconomic backdrop though will be the main driver here. Thursday's CPI report was shocking, but so far yields have remained calm. In fact yields on the US 10-year are down slightly this morning but remain above the significant 2% level. This is the highest since summer 2019. Also of note is the yield curve inversion. The US 10Y - US 2Y yield curve is flattening and is currently at 43bps. The yield curve inversion has a 100% success rate in predicting US recessions going back four decades. Again, this does not bode well for yield-sensitive tech and growth names.
Tesla Stock Forecast
This is a classic macro versus technical divergence. The macro picture looks strained. TSLA stock will find it difficult to make any headway with such a strong macro picture, but technically resistance at $945 looks like it could break. That may be unlikely, but it is worth pointing out just in case.
TSLA shares are stuck in a $945 to $886 range channel and one will break at some point. If it is to be $886, which is FXStreet's guess, then the 200-day moving average is next at $823. The most recent low at $792 is even more significant. If this truly is a continuation of the downtrend started in January, then a lower low should be set. Note how volume has been dropping. This is no surpise as risk was off the table before the CPI yesterday. The Relative Strength Index (RSI) is also weak and below 50, so there is no direction here.
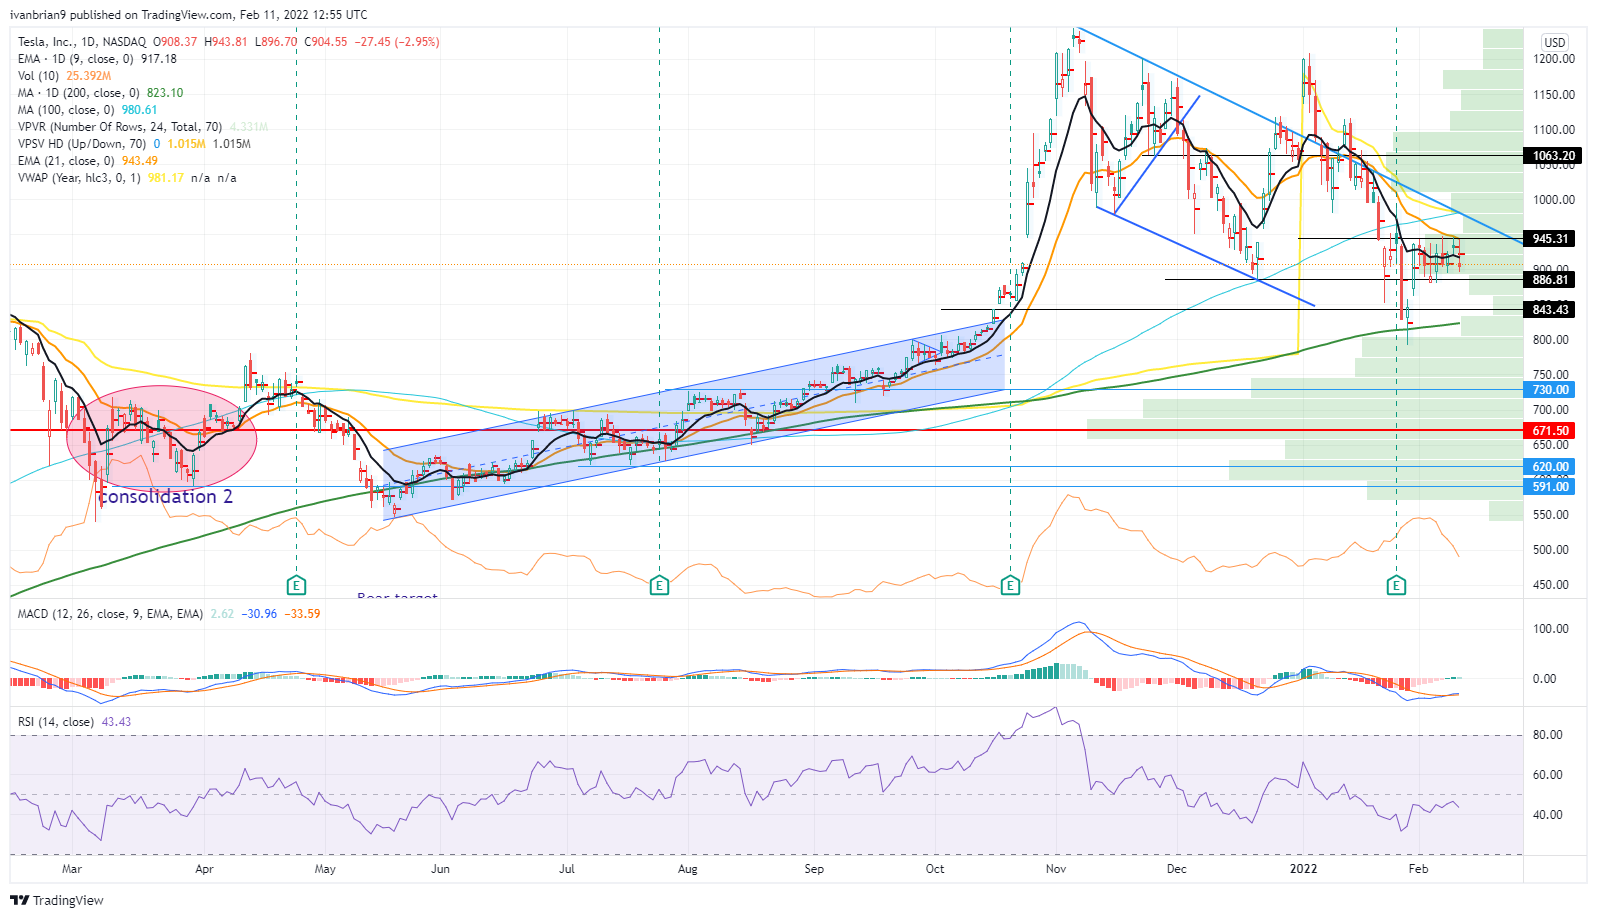
Tesla (TSLA) chart, daily
Like this article? Help us with some feedback by answering this survey:
Information on these pages contains forward-looking statements that involve risks and uncertainties. Markets and instruments profiled on this page are for informational purposes only and should not in any way come across as a recommendation to buy or sell in these assets. You should do your own thorough research before making any investment decisions. FXStreet does not in any way guarantee that this information is free from mistakes, errors, or material misstatements. It also does not guarantee that this information is of a timely nature. Investing in Open Markets involves a great deal of risk, including the loss of all or a portion of your investment, as well as emotional distress. All risks, losses and costs associated with investing, including total loss of principal, are your responsibility. The views and opinions expressed in this article are those of the authors and do not necessarily reflect the official policy or position of FXStreet nor its advertisers. The author will not be held responsible for information that is found at the end of links posted on this page.
If not otherwise explicitly mentioned in the body of the article, at the time of writing, the author has no position in any stock mentioned in this article and no business relationship with any company mentioned. The author has not received compensation for writing this article, other than from FXStreet.
FXStreet and the author do not provide personalized recommendations. The author makes no representations as to the accuracy, completeness, or suitability of this information. FXStreet and the author will not be liable for any errors, omissions or any losses, injuries or damages arising from this information and its display or use. Errors and omissions excepted.
The author and FXStreet are not registered investment advisors and nothing in this article is intended to be investment advice.
Recommended content
Editors’ Picks

AUD/USD tumbles to a five-year low below 0.6000 amid US-China tariffs war
The AUD/USD pair tumbles to near 0.5985 for the first time since the COVID-19 pandemic during the early Asian session on Monday. The Australian Dollar weakens as China slapped a 34% tax on all US imports in retaliation for US President Donald Trump’s tariffs, raising fear of a trade war between the United States and China.

EUR/USD: Markets on edge after US “Liberation Day,” turmoil just began
Financial markets navigated tumultuous waters in the first week of April. US President Donald Trump finally unveiled his reciprocal tariffs plan and spurred panic among worldwide investors. EUR/USD peaked at 1.1146 mid-week, its highest since September 2024, to finally settle at around 1.1000.

Gold correction deepens after new record-high is set on Trump’s tariff announcement
Gold pushed higher with the initial reaction to tariff announcements from the United States on Wednesday and touched a record peak of $3,167 before staging a deep correction heading into the weekend. Investors will stay focused on tariff-related headlines and pay close attention to inflation data from the US.

Week ahead: US CPI and RBNZ decision on tap amidst tariff mayhem
US Dollar traders await US CPI data amid global trade turbulence. RBNZ to cut by 25bps, could maintain dovish stance. China’s CPI and PPI to reveal tariff impact on inflation. Strong UK GDP data could help the pound climb higher.

Strategic implications of “Liberation Day”
Liberation Day in the United States came with extremely protectionist and inward-looking tariff policy aimed at just about all U.S. trading partners. In this report, we outline some of the more strategic implications of Liberation Day and developments we will be paying close attention to going forward.

The Best brokers to trade EUR/USD
SPONSORED Discover the top brokers for trading EUR/USD in 2025. Our list features brokers with competitive spreads, fast execution, and powerful platforms. Whether you're a beginner or an expert, find the right partner to navigate the dynamic Forex market.