Tesla Stock News and Forecast: TSLA trading plan for Thursday
- Tesla loses more ground on Wednesday as the stock sell-off continues.
- TSLA though may be stabilizing as losses slow.
- TSLA stock has not seen a boost from recent stock split.

Tesla (TSLA) lost more ground on Wednesday as the broad stock market sell-off continues. The market had looked to rally at the open, but any enthusiasm was short-lived as equities sold off for the remainder of the session. Tesla at least did manage to stay more or less in line with the major indices, which is a relative outperformance for high-beta stocks. Tesla shares have failed to see any bid interest at all following its 3-for-1 stock split last week. This is unfortunate timing to coincide with the Fed flooding the market with a sucker punch.
Also read: Tesla Stock Deep Dive: Price target at $400 on China headwinds, margin compression, lower deliveries
Tesla stock news
Right now we are all macro traders. For example, take a look at the correlation coefficient for Tesla versus the Nasdaq. It is nearly 1 for 1, so there is very little alpha. Tesla is merely being dragged lower by negative equity sentiment.
We also note some improved delivery times for Tesla coming out of China for the Model Y. This can be taken both ways. Improved delivery times could mean more sales and higher production. Or is it because demand has dropped? We are not yet sure, but more lockdowns in China certainly look bearish to me.
Tesla (TSLA) stock forecast
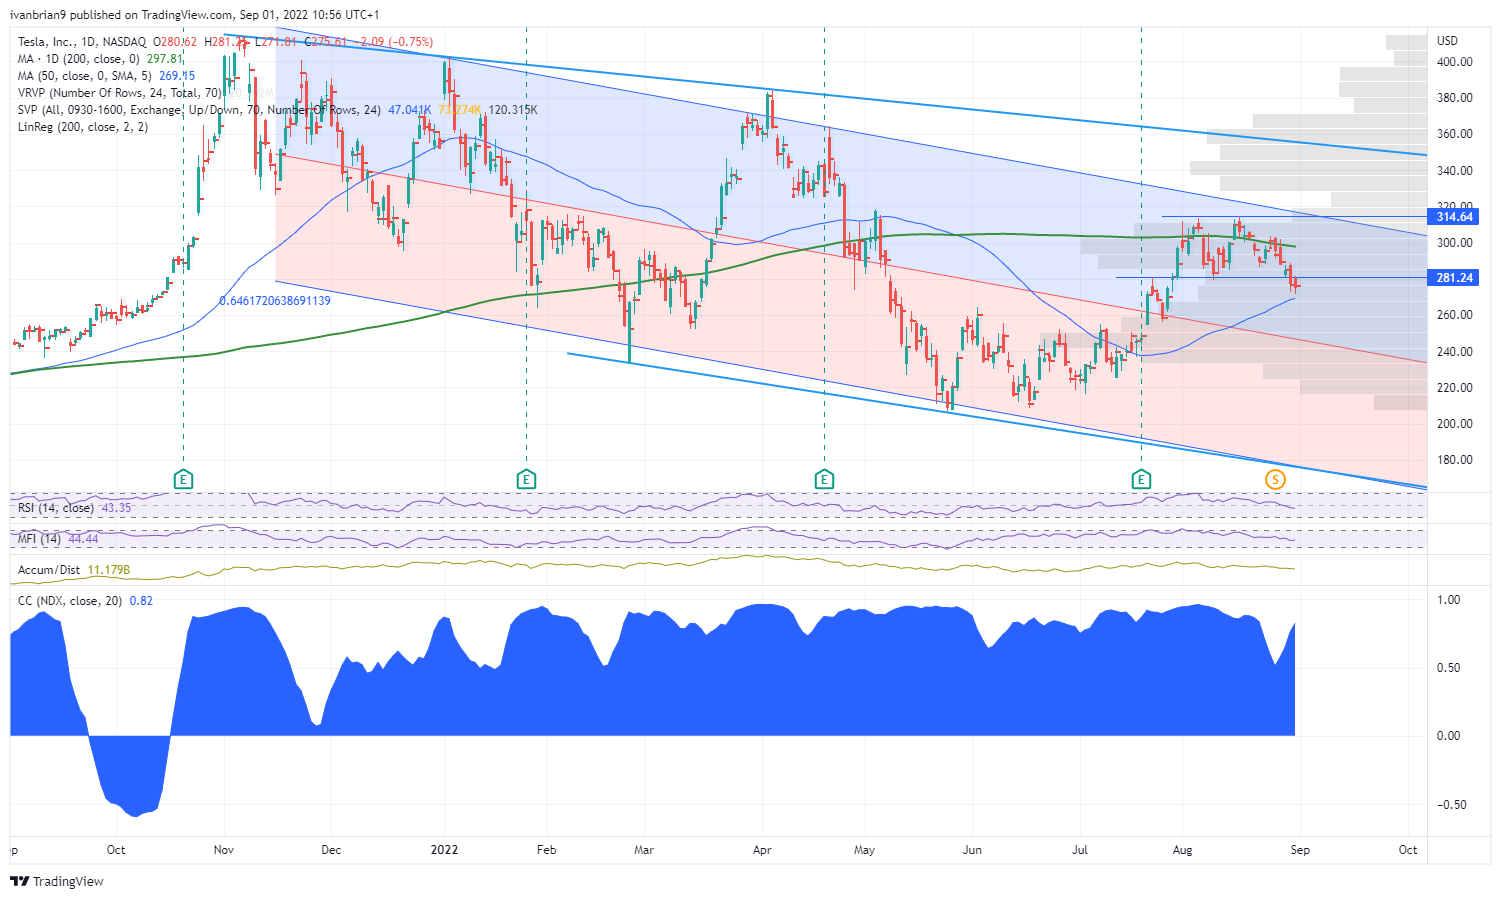
The TSLA stock double top at $314 is still playing out, and the break below $281 is significant. The next key support comes at the 50-day moving average. I have also plotted a new indicator here, the Linear Regression Channel. Simply put, it shows if Tesla stock price has moved significantly about recent norms and so shows if the price may be oversold or overbought. Right now nothing too serious is showing.
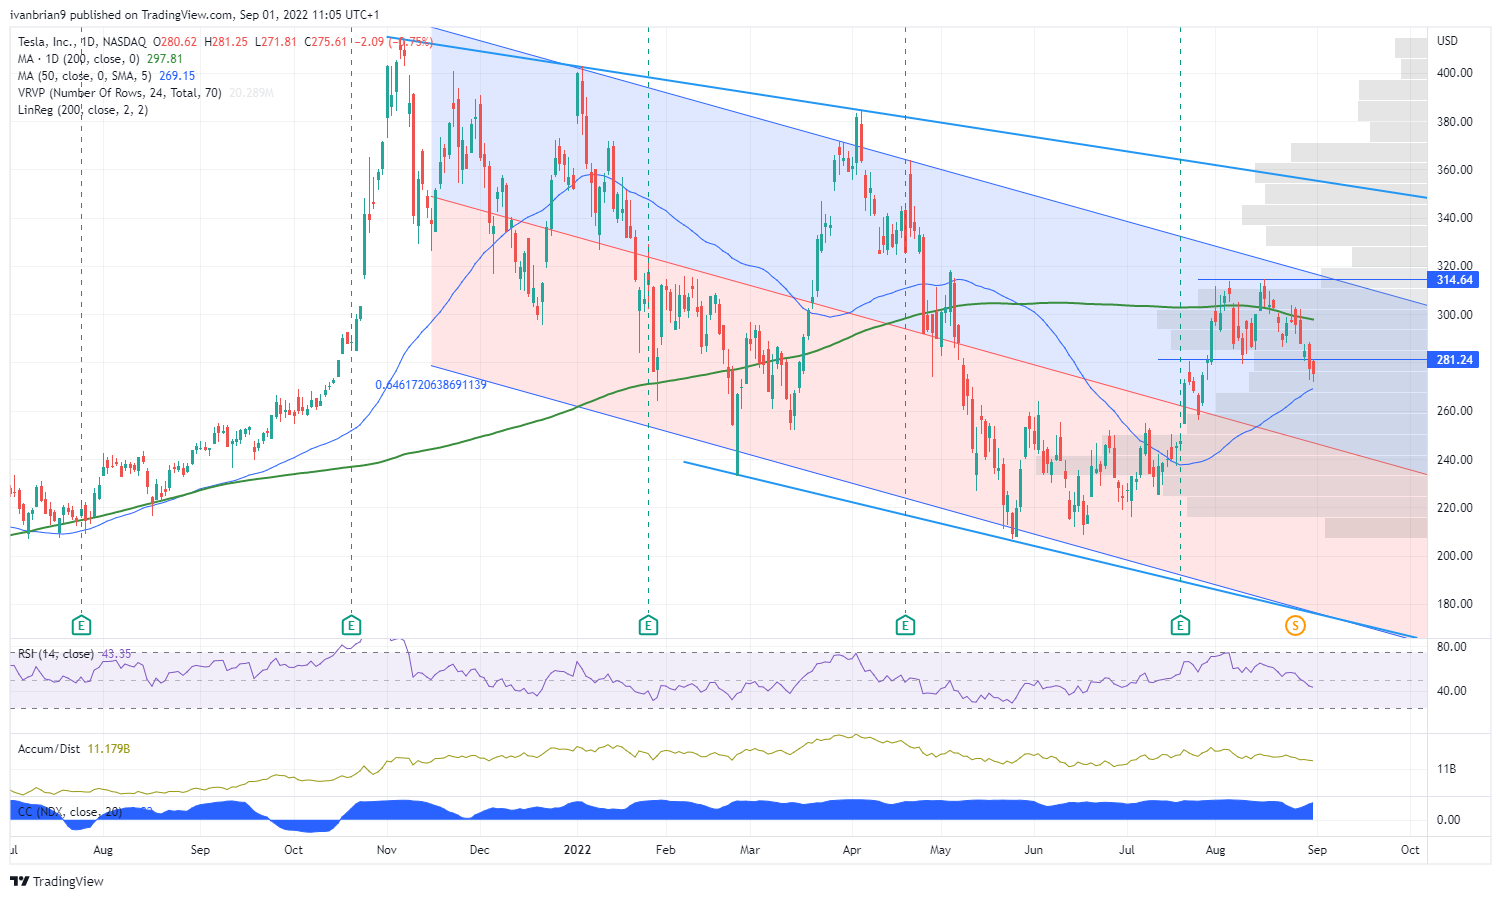
Tesla daily chart
On the TSLA stock intraday chart, there is a nice double bottom at $272/273. This is the short-term pivot as the point of control is just above. It is also near the bottom of the linear regression channel, so looks like a strong support zone.
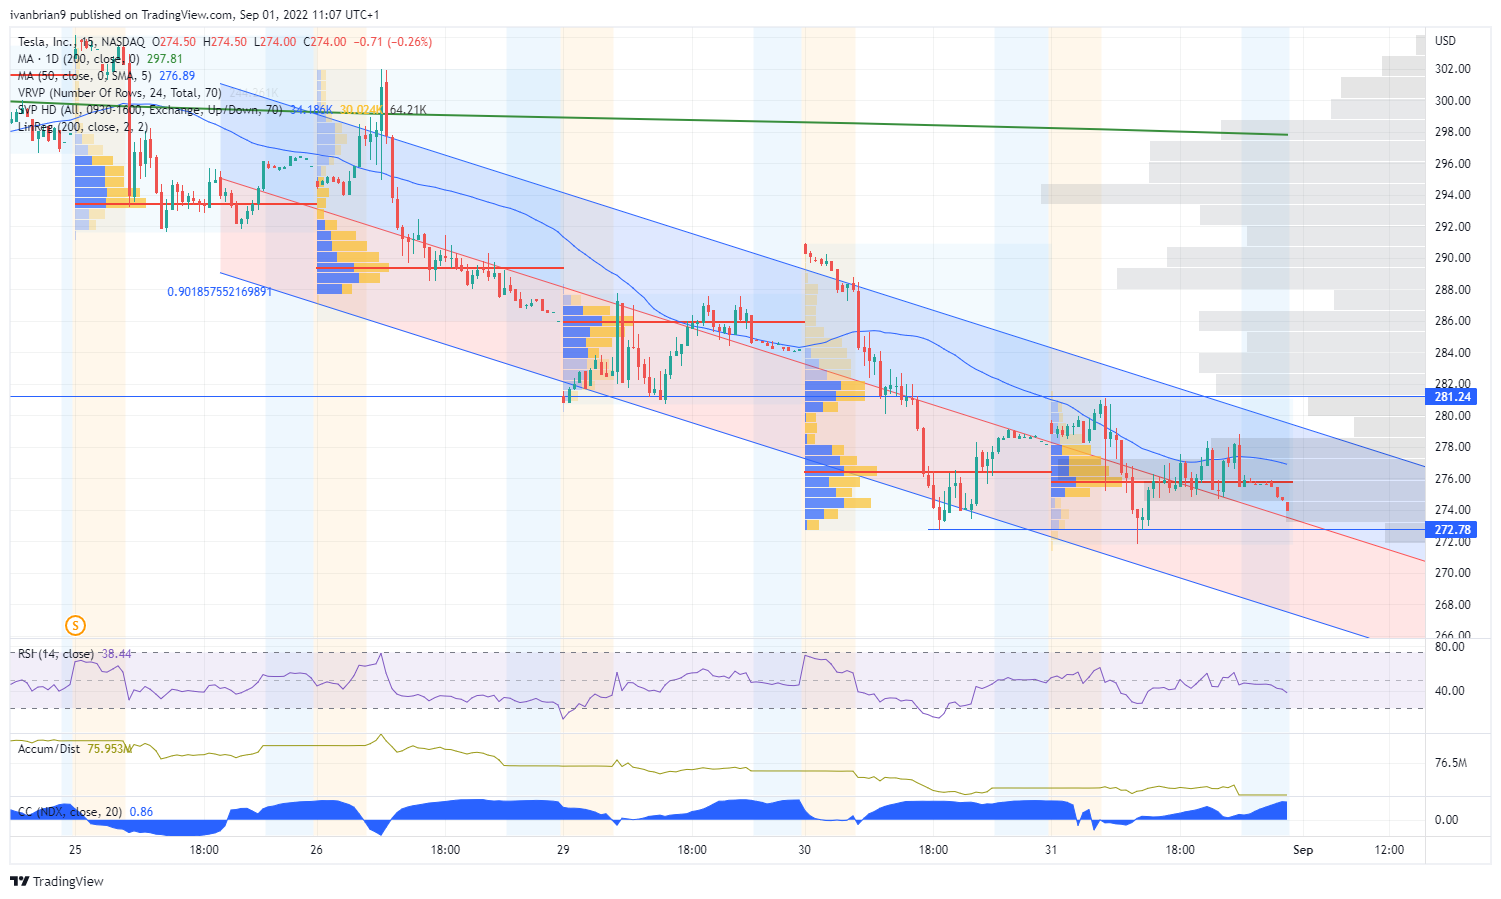
Tesla chart, 15-minute
The author is short Tesla.
Premium
You have reached your limit of 3 free articles for this month.
Start your subscription and get access to all our original articles.
Author

Ivan Brian
FXStreet
Ivan Brian started his career with AIB Bank in corporate finance and then worked for seven years at Baxter. He started as a macro analyst before becoming Head of Research and then CFO.


