- Tesla rally begins to run out of charge.
- Equity markets roll over, and TSLA is a high beta stock.
- TSLA is on target to trade below $300 by the end of the week.
Tesla (TSLA) stock lost ground on Monday as the recent rally in equities began to lose power, and as a result, most tech and mega-cap names lost ground. Tesla was not left behind, and it finished the week losing 1.1% but already doubled that on the first day of the new week.
Worries over what the Fed may say at the upcoming Jackson Hole symposium have led to risk assets being parked for now as yields have risen slightly. Fed funds futures have also moved to price in a slightly greater chance of another 75 basis point hike in September.
Also read: Tesla Stock Deep Dive: Price target at $400 on China headwinds, margin compression, lower deliveries
Tesla stock news
For now, Tesla is being driven by the broader macroeconomic environment. Yes, there were some conflicting news reports about price hikes for FSD being a potential headwind, but reduced delivery times for the Model Y are positive. Overall though most of that is just noise in the current environment. It is momentum and the technical picture that are the current focus.
Tesla stock forecast
Tesla has now drawn a neat double top in the chart from August 4 and August 16. Both sessions saw TSLA stock failing at the $945 resistance level. Double tops are technically negative. The target is the valley to peak ($840 to $945) and is triggered on a break of the valley. This gives a technical target of $735.
For now, this fits with the fundamental picture of a fading equity rally and risk-off sentiment. Technically, the move will not trigger until $840 (the valley) is broken. $840 to $735 is also where we can see a volume gap, which means less price acceptance allows the stock to move through this zone easily. Adding to the bearish view is the bearish divergence on those double tops. The Relative Strength Index (RSI) trended lower from the top of August 4 to 16.
Do no forget the 3-for-1 Tesla stock split on August 25 either means that Tesla will trade somewhere below $300.
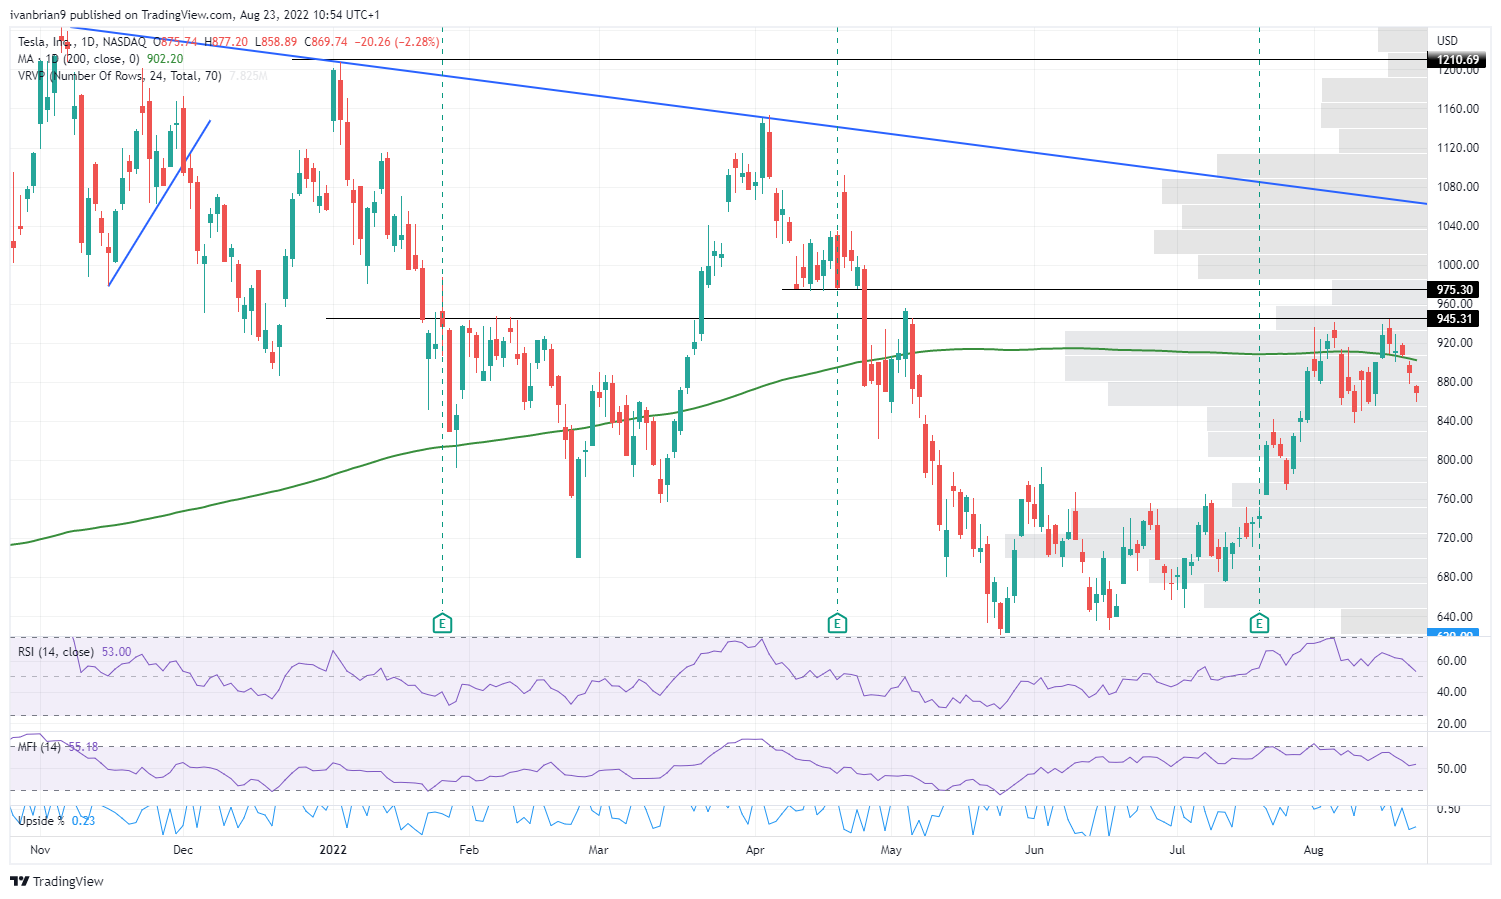
Tesla (TSLA) daily chart
The author is short Tesla.
Information on these pages contains forward-looking statements that involve risks and uncertainties. Markets and instruments profiled on this page are for informational purposes only and should not in any way come across as a recommendation to buy or sell in these assets. You should do your own thorough research before making any investment decisions. FXStreet does not in any way guarantee that this information is free from mistakes, errors, or material misstatements. It also does not guarantee that this information is of a timely nature. Investing in Open Markets involves a great deal of risk, including the loss of all or a portion of your investment, as well as emotional distress. All risks, losses and costs associated with investing, including total loss of principal, are your responsibility. The views and opinions expressed in this article are those of the authors and do not necessarily reflect the official policy or position of FXStreet nor its advertisers. The author will not be held responsible for information that is found at the end of links posted on this page.
If not otherwise explicitly mentioned in the body of the article, at the time of writing, the author has no position in any stock mentioned in this article and no business relationship with any company mentioned. The author has not received compensation for writing this article, other than from FXStreet.
FXStreet and the author do not provide personalized recommendations. The author makes no representations as to the accuracy, completeness, or suitability of this information. FXStreet and the author will not be liable for any errors, omissions or any losses, injuries or damages arising from this information and its display or use. Errors and omissions excepted.
The author and FXStreet are not registered investment advisors and nothing in this article is intended to be investment advice.
Recommended content
Editors’ Picks

Gold gives away some gains, slips back to $2,980
Gold retraced from its earlier all-time highs above the key $3,000 mark on Friday, finding a footing around $2,980 per troy ounce. Profit-taking, rising US yields, and a shift to a risk-on environment seem to be putting the brakes on further gains for the metal.

EUR/USD remains firm and near the 1.0900 barrier
EUR/USD is finding its footing and trading comfortably in positive territory as the week wraps up, shaking off two consecutive daily pullbacks and setting its sights back on the pivotal 1.0900 mark—and beyond.

GBP/USD remains depressed, treads water in the low-1.2900s
GBP/USD is holding steady in consolidation territory after Friday’s opening bell on Wall Street, hovering in the low-1.2900 range. This resilience comes despite disappointing UK data and persistent selling pressure on the USD.

Crypto Today: BNB, OKB, BGB tokens rally as BTC, Shiba Inu and Chainlink lead market rebound
Cryptocurrencies sector rose by 0.13% in early European trading on Friday, adding $352 million in aggregate valuation. With BNB, OKB and BGB attracting demand amid intense market volatility, the exchange-based native tokens sector added $1.9 billion.

Week ahead – Central banks in focus amid trade war turmoil
Fed decides on policy amid recession fears. Yen traders lock gaze on BoJ for hike signals. SNB seen cutting interest rates by another 25bps. BoE to stand pat after February’s dovish cut.

The Best brokers to trade EUR/USD
SPONSORED Discover the top brokers for trading EUR/USD in 2025. Our list features brokers with competitive spreads, fast execution, and powerful platforms. Whether you're a beginner or an expert, find the right partner to navigate the dynamic Forex market.