Tesla Stock Forecast: The TSLA neckline that everyone is watching
- Tesla has overcome the neckline of an Inverse Head & Shoulders pattern, which is bullish.
- TSLA stock has risen 12% over the past month and could rise to $246.20.
- Stifel intiated a Buy rating on Tesla stock this week.
- Wedbush, Wolfe Research also have positive outlook on TSLA.

Could the value destruction finally be over? Unlike the rest of the Magnificent Seven, Elon Musk’s Tesla (TSLA) has remained in a long-term downtrend since its November 2021 all-time high, which is why some members of the gossip class have switched to the new Super Six grouping.
But on Wednesday, June 26, Tesla stock finally broke above the neckline of an Inverse Head-and-Shoulders (H&S) pattern. Now traders are watching the TSLA share price intently to see if it can hold above that neckline and continue the pattern to its projected 28% gain at $246.20.
Tesla stock news
Tesla is benefitting on Thursday from Wolfe Research’s client note that argued further upside should be expected for the Magnificent Seven stocks — Apple (AAPL), Microsoft (MSFT), Alphabet (GOOGL), Nvidia (NVDA), Meta Platforms (META), Amazon (AMZN) and Tesla.
“Our sense is that volatility will continue to pick up over the summer,” writes Wolfe Research’s analyst team. “However, we expect this to generally benefit the Mag 7, secular growers, and the overall Momentum Trade in the weeks ahead.”
Tesla stock is up 12% over the past month and definitely appears to have momentum on its side after breaking through the H&S neckline.
Stifel added to the mix on Wednesday with an initial Buy rating on Tesla stock and a $265 price target. The team at Stifel said that redesigned Model 3s and Model Ys would launch an upgrade cycle and that the coming Model 2 would also expand stalled revenue growth for the electric vehicle (EV) king.
Additionally, Stifel thinks that the RoboTaxi, which is slated for release in Early August, will greatly increase momentum in the stock price, alongside greater recognition of the power of full-self driving (FSD).
Wedbush Securities’ Dan Ives said this week that Tesla is back on the trail to achieving a $1 billion market cap, which would mean a 60% gain from here. Ives cited the RoboTaxi event on August 8, as well as the FSD and artificial intelligence (AI) initiatives, as the main catalysts. Ives has a $350 price target on Tesla.
Interactive Brokers said Tesla was the second-most traded stock on its platform on Tuesday, June 25, just behind Nvidia. On the same day, Tesla issued a recall for 11,688 Cybertrucks due to a windshield wiper motor controller malfunctioning. Slightly fewer Cybertrucks were also recalled due to the possible missattachment of trunk bed trim during production.
EV stocks FAQs
Electric vehicles or EVs are automobiles that use rechargable batteries and electric motors to accelerate rather than internal combustion engines (ICEs). They have been around for more that 100 years, but battery technology research & development was meager for much of the 20th century. Lithium-ion battery technology became advanced enough to produce EVs at scale in the late 1990s and 2000s, and sales have been steadily increasing since then Tesla’s Roadster was unveiled in 2008. EVs are viewed as a means of reducing carbon emissions since battery electric vehicles (BEVs) themselves produce zero emissions. Other vehicles called plug-in hybrid electric vehicles (PHEVs) utilize both battery electric power and ICEs as a backup.
EVs are growing from a small base, but they rose from 9% of global new auto sales in 2021 to 14% of the total in 2022. This was a 65% YoY growth rate, and the industry delivered 10.2 million EVs worldwide in 2022. Projections show this number climbing above 16 million in 2023. Across the world, market shares differ greatly among nations. Nearly 88% of Norwegian new car sales in 2022 were EVs. On the other hand, the United States, where much of the modern innovation in EVs was forged, had less than 8% of new vehicle sales go to EVs in 2022. The largest EV market in the world, China, saw 30% of the market go to EVs that year.
We know you’re thinking Elon Musk, but he’s probably more like the father of the mass-market, contemporary EV. All the way back in 1827, a Hungarian priest named Anyos Jedlik invented the electric motor and used it the following year to power a vehicle of sorts. French scientist Gaston Planté invented the lead-acid battery in 1859, and German engineer Andreas Flocken built the first true electric car for the public in 1888. EVs made up about 38% of all vehicles sold in the US around 1900. They began losing market share rapidly after 1910 when gasoline-powered vehicles grew much more affordable. They largely died off until new research programs in the 1990s led to gradual private sector investment in the 2000s.
China’s BYD is by far the largest manufacturer of EVs in the world. In 2022 it sold 1.8 million EVs and in the second half of the year made up 20% of the global market. The asterisk given to BYD is that the vast majority of these vehicles are hybrids. Tesla’s 12% market share is often treated as more significant than BYD, because it only sells BEVs and is the most famous EV brand in the world. Volkswagen, BMW and Wuling then round out the top five. As a new sector with heavy investment though, many startups have flooded the market. These include China’s Nio, Li Auto and Xpeng; a Swedish-Chinese manufacturer called Polestar; and Lucid and Rivian from the US.
Tesla stock forecast
The Inverse Head & Shoulders pattern is noted by the pink curves on the daily chart below. Two range lows of similar height (shoulders) surround the range low (head) that reached a low of $138.80 on April 22.
An augmented target price would be taking the difference between the head and the price of the neckline where TSLA broke above it. The difference between $138.80 and $192.50 is $53.70. Adding the difference to the neckline break gives us a target price of $246.50, a 28% gain.
Two barriers stand in the way of this chart pattern from succeeding. First, the 200-day Simple Moving Average (SMA) is gliding by at $206.50. Then there is the descending resistance band that has been in place since July 2023. It currently traverses $217 to $227.
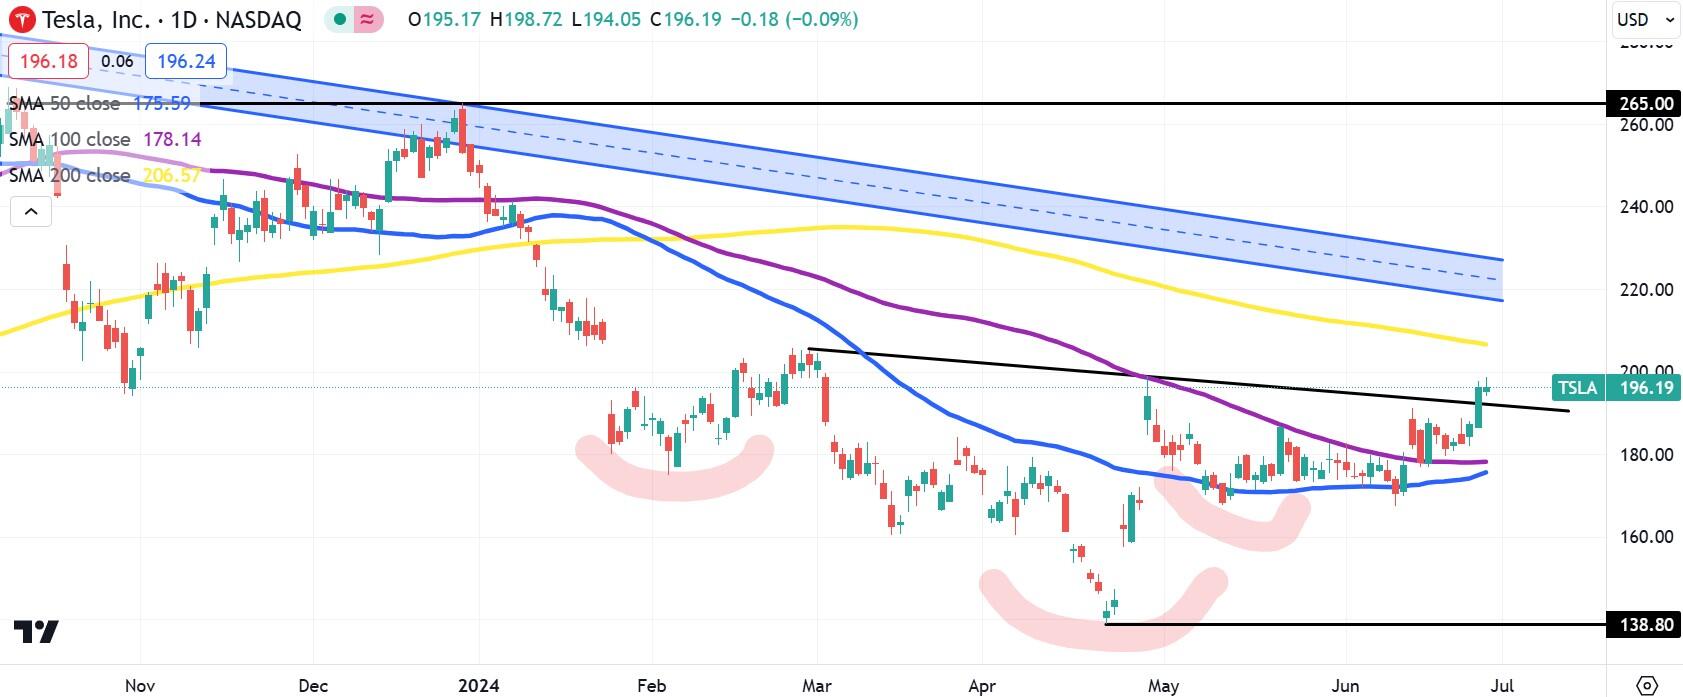
TSLA daily stock chart
Premium
You have reached your limit of 3 free articles for this month.
Start your subscription and get access to all our original articles.
Author

Clay Webster
FXStreet
Clay Webster grew up in the US outside Buffalo, New York and Lancaster, Pennsylvania. He began investing after college following the 2008 financial crisis.


