Tesla Inc. (TSLA) Elliott Wave technical analysis [Video]
![Tesla Inc. (TSLA) Elliott Wave technical analysis [Video]](https://editorial.fxstreet.com/images/Markets/Equities/Industries/EnergyStocks/power-grid-637435385726548930_XtraLarge.jpg)
TSLA Elliott Wave technical analysis
Function: Trend.
Mode: Impulsive.
Structure: Motive.
Position: Minor wave 3.
Direction: Upside in 3 of (1).
Details: Looking for upside thrust after the completion of the long lasting triangle in primary wave 4. Looking for upside towards Medium level at 400$.
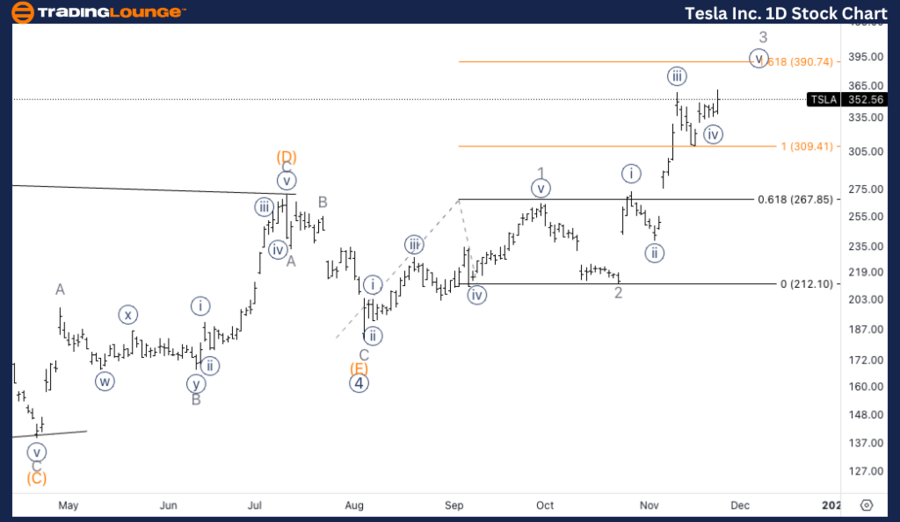
TSLA Elliott Wave technical analysis – Daily chart
Tesla (TSLA) is in the midst of Minor wave 3 within the larger Primary wave 5 following the completion of a long-lasting triangle in Primary wave 4. The analysis suggests a continuation of the upside thrust, with the price aiming for the Medium Level at $400. This move represents the third wave in a motive structure, often characterized by strong momentum and sharp gains. The daily outlook remains bullish with expectations of further gains as this wave develops.
TSLA Elliott Wave technical analysis
Function: Trend.
Mode: Impulsive.
Structure: Motive.
Position: Wave {v} of 3.
Direction: Upside in wave {v}.
Details: We have found support on top of the parallel channel and we are looking for 0.618 {v} vs. {i} at exactly where 1.618 3 vs. 1 stands at 390$, and equality of {v} vs. {i} at 433.
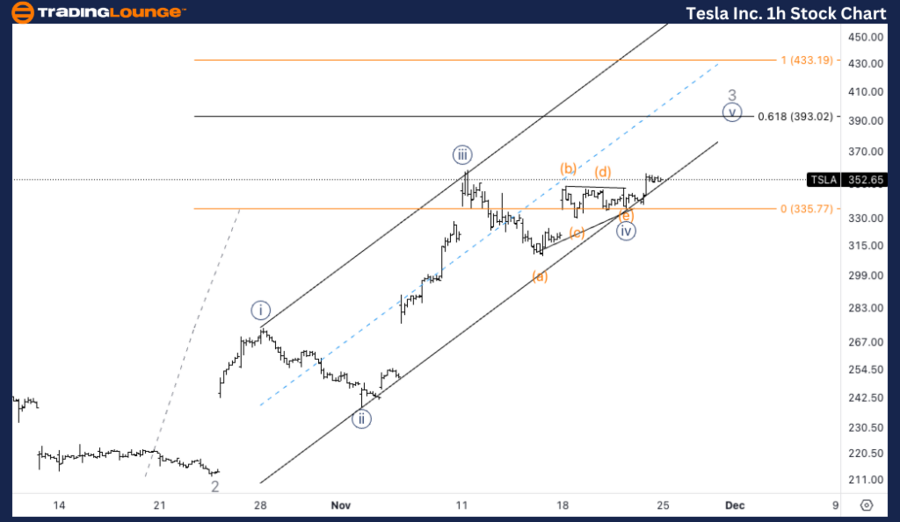
TSLA Elliott Wave technical analysis – One-hour chart
On the 1-hour chart, Tesla has found support at the top of the parallel channel, indicating the potential for further upside in wave {v} of 3. Specific targets are being identified, with 0.618 of {v} vs. {i} aligning with 1.618 of wave 3 vs. 1, both converging at the $390 level. Should the wave extend, equality of {v} vs. {i} stands at $433, providing another key resistance level for traders to monitor.
This Elliott Wave analysis for Tesla Inc., (TSLA) examines both the daily and 1-hour charts to assess its current market trend, utilizing Elliott Wave Theory to anticipate potential future movements.
Tesla Inc. (TSLA) Elliott Wave technical analysis [Video]
Author

Peter Mathers
TradingLounge
Peter Mathers started actively trading in 1982. He began his career at Hoei and Shoin, a Japanese futures trading company.


