Tencent Holdings Stock Forecast: TCEHY at 5-year low
- Tencent Holdings stock is now trading at the same price as summer 2017.
- Chinese equities are being hurt due to covid lockdowns.
- Chinese lockdowns are in turn reducing the price of oil, which is helping US stocks.

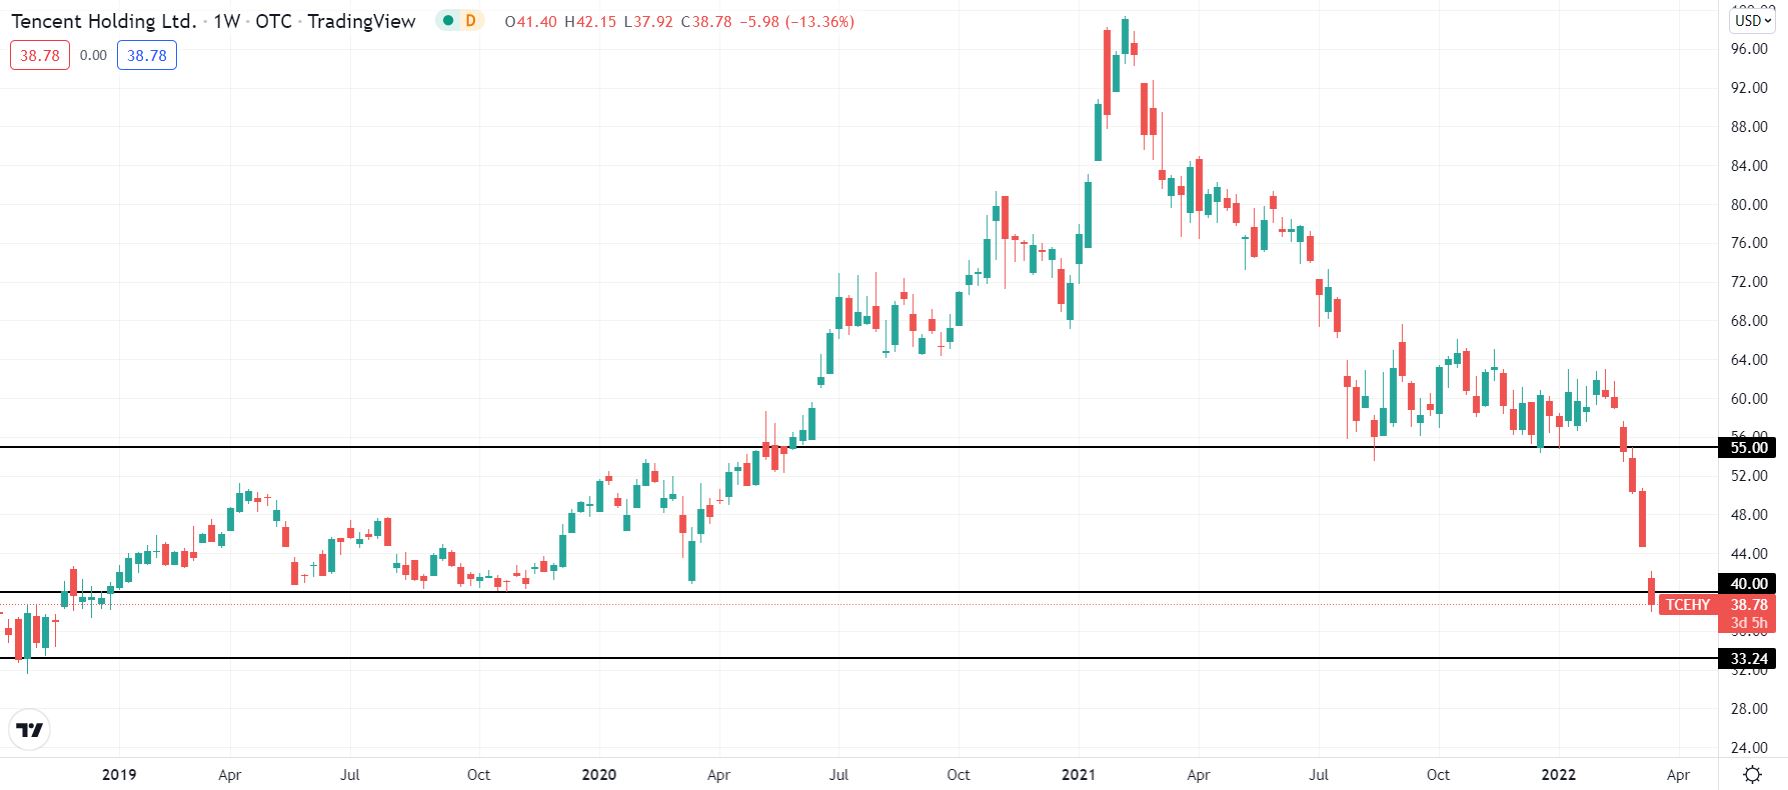
Tencent Holdings (TCEHY) has dropped below $40 on Tuesday as Chinese equities continue their plunge due to new covid-related lockdowns in China. Dongguan is only the latest city to receive a lockdown order. Though it may not be a well-known city in the West, Dongguan is the fifth-largest city in China by economic output. At the time of writing, shares are down 4% just above $39. This is the same price as TCEHY traded at in July 2017.
Tencent Stock News: Covid sell-off comes for Chinese equities
Tencent stock has not traded below $40 since December 2018 and first trade here in the summer of 2017. Shares of the digital conglomerate were already down by about 40% last year but have fallen by about a third just since the advent of Russia's invasion of Ukraine.
News swirling around the market on Tuesday is somewhat at odds with one another. US stock by and large are surging due to oil prices falling below $100 a barrel. Nasdaq is up about 2.2% at the time of writing. While there is some hope of Ukraine peace talks that are ongoing at the moment, the covid restrictions and lockdowns that are being extended throughout China are expected to reduce oil demand in the world's largest nation and thus offer a respite to the oil price globally in the short term.
Meanwhile, these same lockdowns are expected to reduce overall demand and output in China, so Chinese stocks are somewhat unhinged from the global markets in that the current downturn is a covid sell-off.
Tencent Stock Forecast: Gunning for $33
2022 has been nothing if not flabbergasting for stock investors. Higher inflation and talk of raising interest rates halted the growth stock dominance of the covid pandemic. Now higher energy prices caused by Russia's invasion of Ukraine and subsequent sanctions have had investors giving in to capitulation. This is why traders need to take a good, long look at chart levels from half a decade ago. Without a sudden peace accord or reduction in Chinese covid infections, more pain is likely in the cards.
Now is the time to focus on $33 (or rather $33.24 to be exact). This is where TCEHY stock found its footing back in October 2018. Above there Tencent stock found a price ledge around $35 during the summer of 2017, but October 2018 showed that $35 did not have enough support. If there is a bottom at all in Tencent's near future, it should be found in the low $33s.
Regaining $40 will bring TCEHY back to neutral. Closing above $55 will put it back in bullish territory.
Tencent weekly chart
Premium
You have reached your limit of 3 free articles for this month.
Start your subscription and get access to all our original articles.
Author

Clay Webster
FXStreet
Clay Webster grew up in the US outside Buffalo, New York and Lancaster, Pennsylvania. He began investing after college following the 2008 financial crisis.


