|premium|

Technology select sector SPDR fund (XLK Stock)

In this technical blog, we will look at the past performance of 4 hour Elliott Wave Charts of XLK. In which, the rally from 23 March 2020 low unfolded as an impulse and showed a higher high sequence. Therefore, we knew that the structure in XLK is incomplete to the upside & should see more upside. So, we advised members not to sell the ETF & buy the dips in 3, 7, or 11 swings at the blue box areas. We will explain the structure & forecast below:

XLK 4 hour Elliott Wave chart

XLK

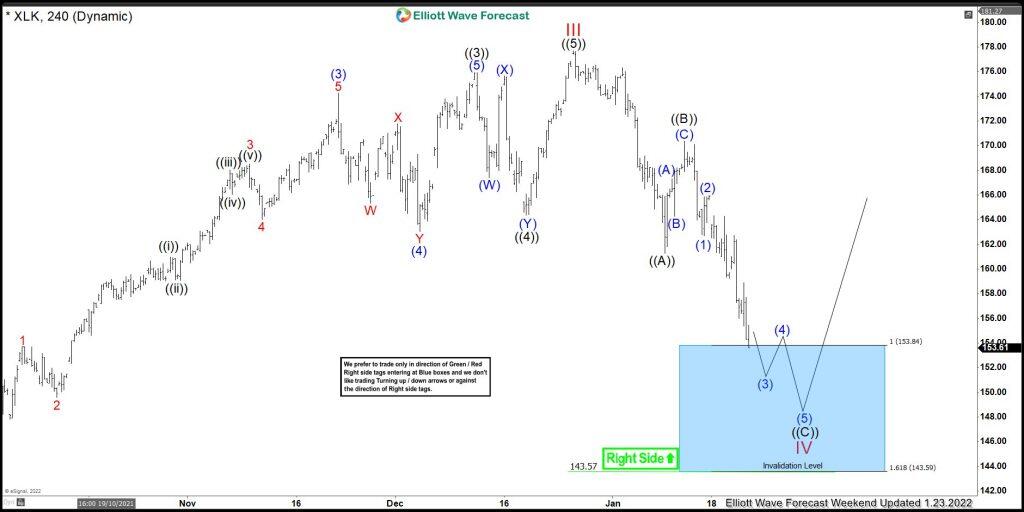
Here’s 4hr Elliott wave Chart from the 1/23/2022 Weekend update. In which, the rally to $177.68 high ended the cycle from 23 March 2020 low in cycle degree wave III & made a pullback in wave IV. The internals of that pullback unfolded as Elliott wave zigzag structure where wave ((A)) ended in 5 swings at $161.29 low. Then a bounce to $170.36 high ended wave ((B)) & started the next leg lower in wave ((C)) towards $153.84- $143.59 blue box area. From there, buyers were expected to appear looking for new highs ideally or for a 3 wave bounce minimum.

XLK latest 4 hour Elliott Wave chart

XLK

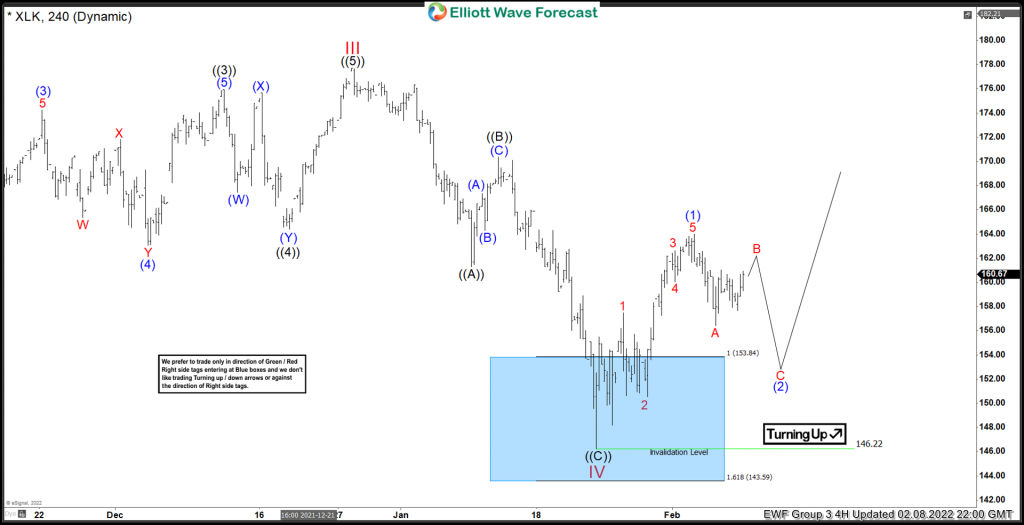
Above is the latest 4hr Elliott wave Chart from the 2/08/2022 update. In which the ETF is showing a reaction higher taking place from the blue box area at $153.84- $143.59. Right after ending the zigzag correction within the blue box area. Allowed members to create a risk-free position with the minimum reaction higher towards 50%- 61.8% Fibonacci retracement from the peak at $161.98- $165.69 area. However, a break above $177.68 high is still needed to confirm the next extension higher & avoid double correction lower.

Premium

You have reached your limit of 3 free articles for this month.

Start your subscription and get access to all our original articles.

Subscribe to PremiumSign In

Author

Elliott Wave Forecast Team

Elliott Wave Forecast Team

ElliottWave-Forecast.com

More from Elliott Wave Forecast Team
Share:

Editor's Picks

EUR/USD flat lines below 1.1900; divergent Fed-ECB expectations offer support

The EUR/USD pair struggles to capitalize on the overnight bounce from the 1.1835-1.1830 region and oscillates in a narrow band during the Asian session on Thursday. Spot prices currently trade around the 1.1875 area, remaining nearly unchanged for the day and staying within striking distance of an over one-week high, reached on Tuesday, amid mixed cues.

GBP/USD slips heading into the Thursday trading window

The Pound Sterling pulled back from four-year highs on Wednesday, weighed down by a combination of Bank of England dovishness and UK political uncertainty, even as the US Dollar weakened on soft labor market revisions. 

Gold posts modest gains above $5,050 as US-Iran tensions persist despite strong labor data

Gold price trades in positive territory near $5,060 during the early Asian session on Thursday. The precious metal edges higher despite stronger-than-expected US employment data. The release of the US Consumer Price Index inflation report will take center stage later on Friday. 

Bitcoin holds steady despite strong US labour market

Bitcoin briefly bounced from $66,000 to above $68,000 but slightly reversed those gains following Wednesday's US January jobs report. The top crypto is hovering around $67,000, down 2% over the past 24 hours as of writing on Wednesday.

The market trades the path not the past

The payroll number did not just beat. It reset the tone. 130,000 vs. 65,000 expected, with a 35,000 whisper. 79 of 80 economists leaning the wrong way. Unemployment and underemployment are edging lower. For all the statistical fog around birth-death adjustments and seasonal quirks, the core message was unmistakable. The labour market is not cracking.

XRP sell-off deepens amid weak retail interest, risk-off sentiment

Ripple (XRP) is edging lower around $1.36 at the time of writing on Wednesday, weighed down by low retail interest and macroeconomic uncertainty, which is accelerating risk-off sentiment.