Technology and energy sectors are in final stages of the wedge pattern [Video]
![Technology and energy sectors are in final stages of the wedge pattern [Video]](https://editorial.fxsstatic.com/images/i/Commodities_Gas-1_XtraLarge.jpg)
ETFs of technology sector (XLK) and energy sector (XLE) are trading in the final 5th wave of the wedge pattern, but there’s still space for slightly higher targets, ideally up to the upper wedge line before we will see a top formation this year.
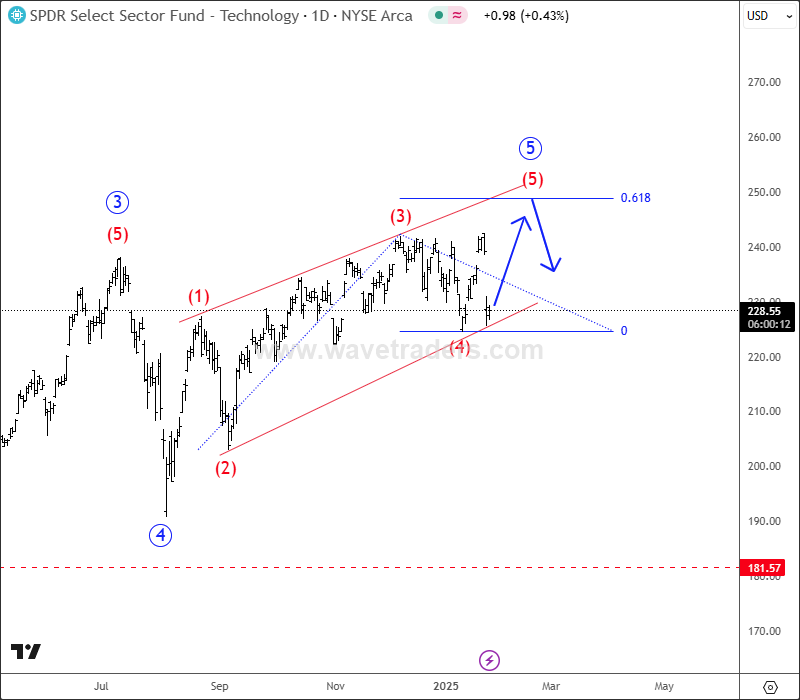
XLK Daily Chart
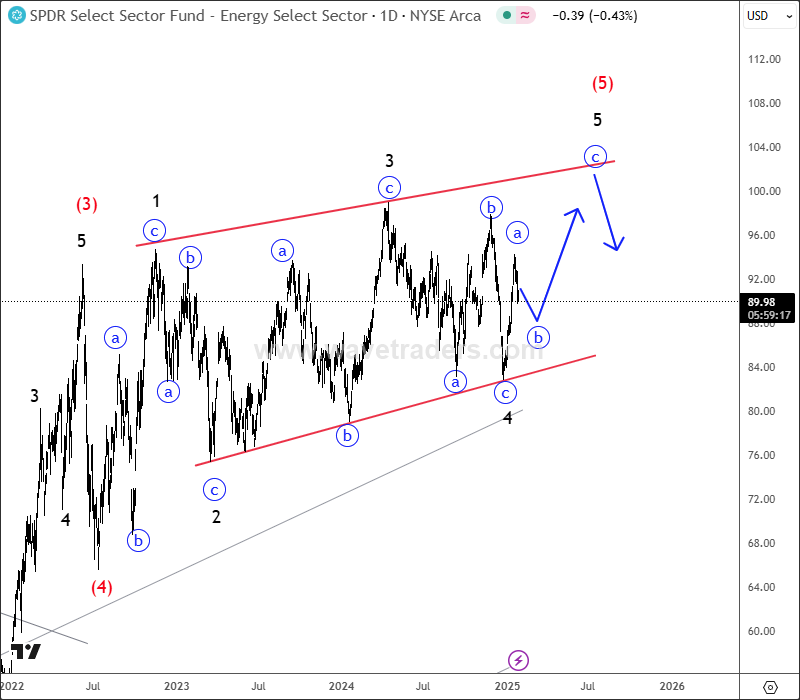
XLE Daily Chart
Ending diagonal a.k.a. wedge pattern is a special reversal type of the pattern labeled with waves 1-2-3-4-5, where each leg is made by three subwaves. Normally it will occur in a fifth wave but we can also find it in wave C or sometimes in wave Y of a complex correction. So, it means they occur in very late stages of higher degree trends, and normally the price action will be slow, choppy, and overlapping with a very low volume and momentum. But after the market clears some stops with minor highs/lows within waves 3 and waves 5, the market will normally make a sharp and explosive turn in the opposite direction. A confirmation point for a change in trend is when wave 2-4 line is broken, plus a closing price beyond wave 4 termination level. When the diagonal is completed you can expect the price to retrace back to the starting point of the pattern.
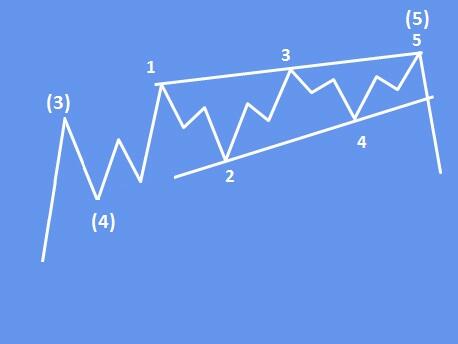
Basic Ending diagonal/wedge pattern.
For more analysis like this, you may want to watch below our latest video analysis recorded on January 25:
Get Full Access To Our Premium Elliott Wave Analysis For 14 Days. Click here.
Get Full Access To Our Premium Elliott Wave Analysis For 14 Days. Click here.
Author

Gregor Horvat
Wavetraders
Experience Grega is based in Slovenia and has been in the Forex market since 2003.


