TECH MAHINDRA Elliott Wave technical analysis [Video]
![TECH MAHINDRA Elliott Wave technical analysis [Video]](https://editorial.fxstreet.com/images/Markets/Equities/Industries/Automobiles/car-engine-637322356428414665_XtraLarge.jpg)
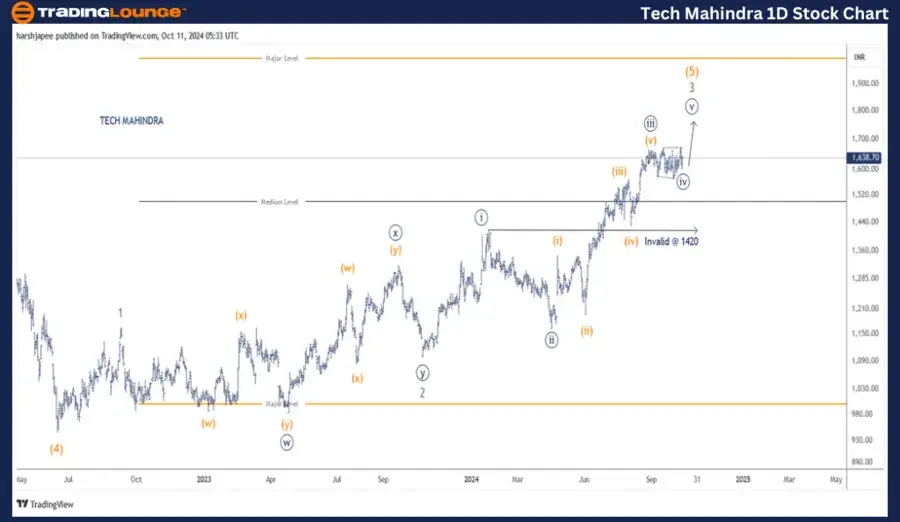
TECH MAHINDRA – TECHM (1D chart) Elliott Wave technical analysis
Function: Larger Degree Trend Higher (Intermediate Degree, Orange).
Mode: Motive.
Structure: Impulse.
Position: Minute Wave ((iv)) Navy.
Details: Minute Wave ((iv)) might be complete as a triangle around the 1600 mark. If correct, Minute Wave ((v)) to resume higher soon.
Invalidation point: 1420.
Tech Mahindra Daily Chart Technical Analysis and potential Elliott Wave Counts:
Tech Mahindra daily chart is indicating a progressive trend higher towards 1800 levels as Minor Wave 3 Grey unfolds. High probability remains that the stock is preparing to resume Minute Wave ((v)) of Minor Wave 3 and prices should ideally stay above 1575 mark.
Tech Mahindra had terminated Intermediate Wave (4) Orange around 940 levels in June 2022. Since then, Minor Waves 1 and 2 completed around 1160 and 1105 levels respectively. Furthermore, Minute Waves ((i)) through ((iv)) of Minor Wave 3 also look complete.
If the above proposed counts are correct, the stock should resume higher towards 1700-1800 zone as Minute Wave ((iv)) triangle completes. Thereafter, prices should ideally stay above 1420, the termination of Minute Wave ((i)).
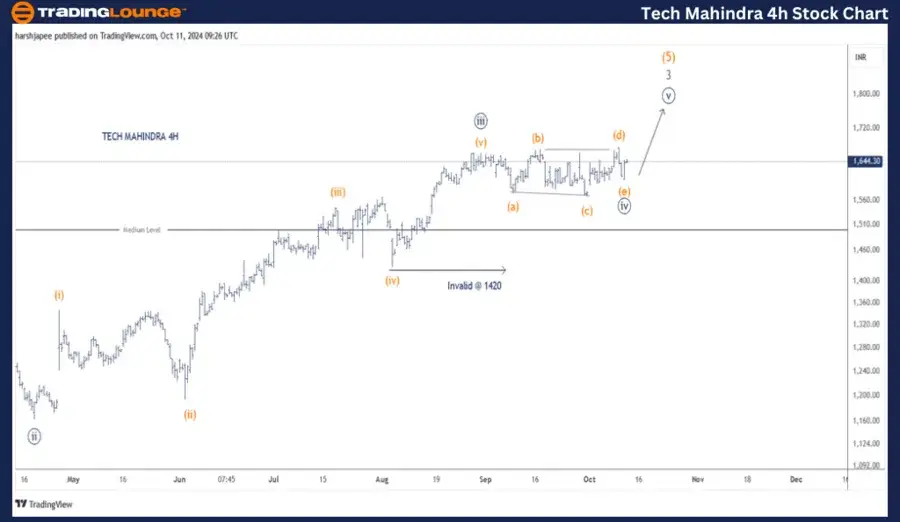
TECH MAHINDRA – TECHM (4H Chart) Elliott Wave technical analysis
Function: Larger Degree Trend Higher (Intermediate Degree, Orange)
Mode: Motive
Structure: Impulse
Position: Minute Wave ((iv)) Navy
Details: Minute Wave ((iv)) might be complete as a triangle around the 1600 mark. If correct, Minute Wave ((v)) of Minor Wave 3 Grey within Intermediate Wave (5) Orange to resume higher soon.
Invalidation point: 1420.
Tech Mahindra 4H Chart Technical Analysis and potential Elliott Wave Counts:
Tech Mahindra 4H chart is highlighting the sub waves since Minute Wave ((ii)) of 3. Minute Wave ((iii)) is an impulse followed by a potential triangle unfolding as Minute Wave ((iv)), which is potentially complete around 1600 mark. If correct, Minute Wave ((v)) should be ready to turn higher from here.
Conclusion:
Tech Mahindra is progressing higher within Minute Wave ((v)) of Minor Wave 3 Grey within Intermediate Wave (5) Orange against 1420 mark.
Elliott Wave analyst: Harsh Japee.
TECH MAHINDRA – TECHM (1D chart) Elliott Wave technical analysis [Video]
Author

Peter Mathers
TradingLounge
Peter Mathers started actively trading in 1982. He began his career at Hoei and Shoin, a Japanese futures trading company.


