TCS Elliott Wave technical analysis [Video]
![TCS Elliott Wave technical analysis [Video]](https://editorial.fxstreet.com/images/Markets/Equities/Industries/Retailing/pic-pexels-artem-beliaikin-2292953-637435400820863972_XtraLarge.jpg)
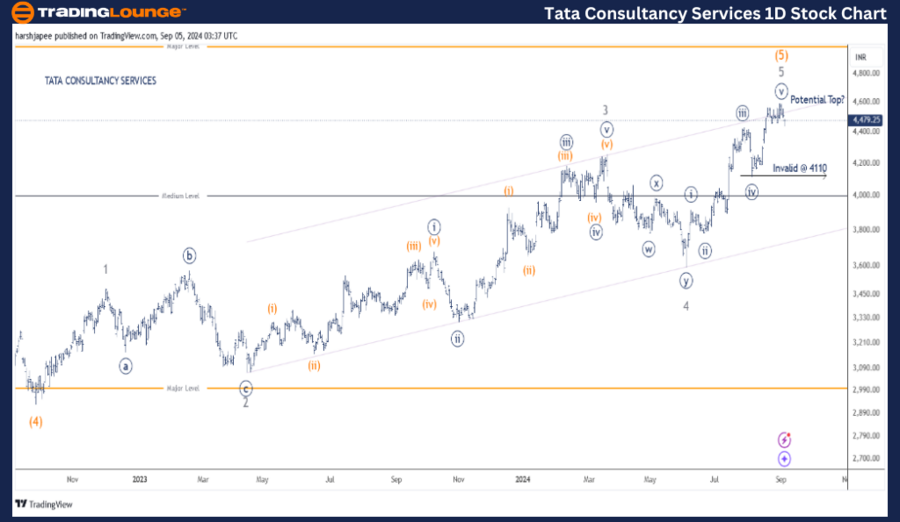
TATA Consultancy Services– TCS (One day chart) Elliott Wave technical analysis
Function: Larger Trend Higher (Intermediate degree Wave (5), orange)
Mode: Motive.
Structure: Impulse.
Position: Minute Wave ((v)) Navy.
Details: Minute Wave ((v)) Navy, is nearing completion or is complete around 4600. Traders might want to consider taking profits now and remain cautious. Channel resistance tested. A major potential top could be in place.
Invalidation point: 4110.
TCS Daily Chart Technical Analysis and potential Elliott Wave Counts:
TCS daily chart is indicative of a potential top in place around 4600 mark. The stock has turned lower for now and is trading around 4460 at the time of writing. It could be a bit early but potential remains for Minute Wave ((v)) Navy within Minor Wave 5 Grey, to have completed.
TCS has been rallying within Intermediate Wave (5) Orange since September 2022 lows registered around 2920 mark. The above can be clearly subdivided into five waves potentially terminating close to 4600 on September 02, 2024.
Also note the channel resistance being tested around the 4600 zone. If the above structure holds well, the stock could very well come under control of bears as they drag towards 4110 initial support. Alternatively, a clear push above 4600 mark would void the bearish scenario.
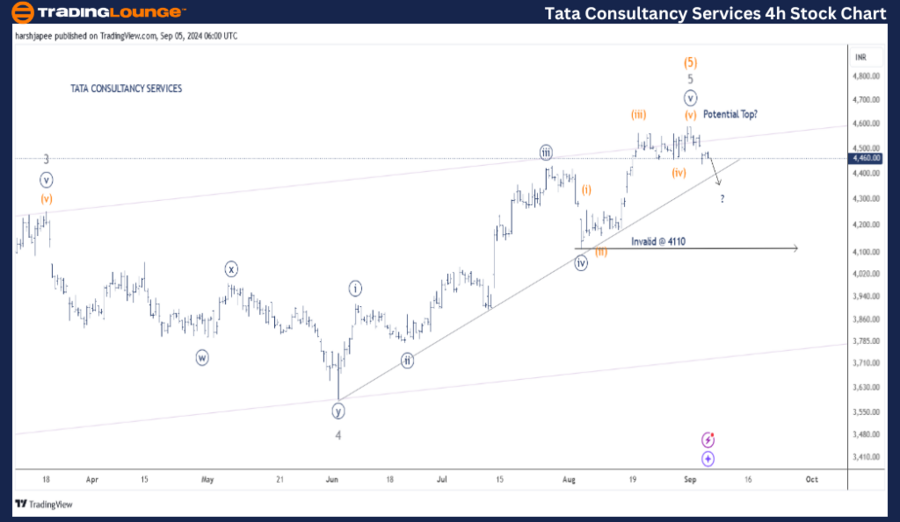
TATA Consultancy Services – TCS (Four-hour chart) Elliott Wave/technical analysis
Function: Larger Trend Higher (Intermediate degree Wave (5), orange).
Mode: Motive.
Structure: Impulse.
Position: Minute Wave ((v)) Navy.
Details: Minute Wave ((v)) Navy, is nearing completion or is complete around 4600. The rally between 4110 and 4600 looks sub divides in five waves. Traders might want to consider taking profits now and remain cautious. Channel resistance is tested. A major potential top could be in place.
Invalidation point: 4110.
TCS 4H Chart Technical Analysis and potential Elliott Wave Counts:
TCS 4H chart helps identify the rally between Minor Wave 4 at 4110 and 4600 levels as an impulse. The Minuette wave looks complete around 4600 with prices reversing sharply. If the above holds, prices would drop through 4110 in the near term.
Conclusion:
TCS could be preparing for a larger degree corrective wave against 4600 high. This could be a bit early but traders must remain cautious at these levels and consider profits.
Technical analyst: Harsh Japee.
TATA Consultancy Services – TCS (Four-hour chart) Elliott Wave/technical analysis [Video]
Author

Peter Mathers
TradingLounge
Peter Mathers started actively trading in 1982. He began his career at Hoei and Shoin, a Japanese futures trading company.


