Tata Steel Elliott Wave technical analysis [Video]
![Tata Steel Elliott Wave technical analysis [Video]](https://editorial.fxstreet.com/images/TechnicalAnalysis/ChartPatterns/Chartism/generic-chart-19151967_XtraLarge.jpg)
TATA Steel Elliott Wave technical analysis
Function: Counter Trend (Minor degree, Grey).
Mode: Corrective.
Structure: Impulse within Larger degree Zigzag.
b Minor Wave 2 Grey.
Details: Major top might be in place at 185 mark. Further the stock has dropped as an impulse to 142, terminating potential Minor Wave 1 Grey. Wave 2 Grey also could be complete just below 160 mark; if correct Wave 3 Grey is now underway. Alternatively, Wave 2 Grey might still push through 170 levels.
Invalidation point: 185.
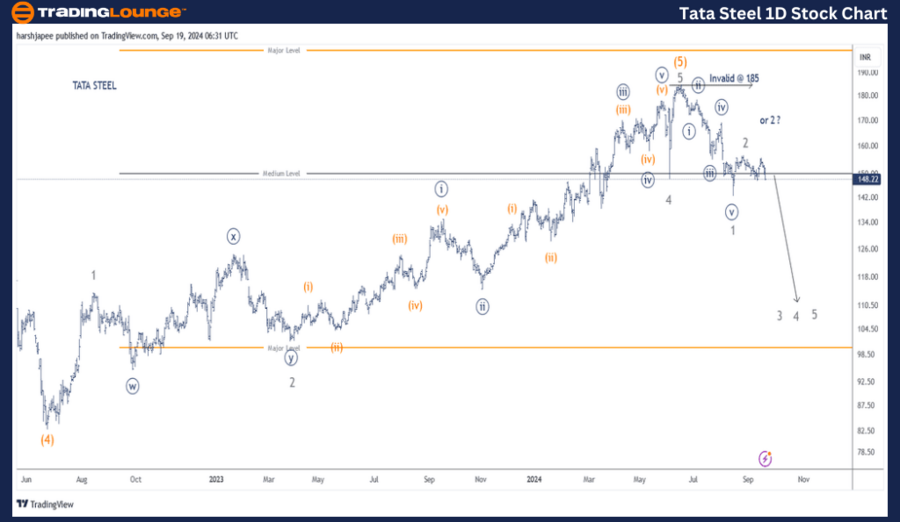
TATA Steel daily chart technical analysis and potential Elliott Wave counts
TATA Steel daily chart suggests a major top is in place around 185 mark on June 14, 2024. It is marked as Minor Wave 5 Grey of Intermediate Wave (5) Orange. Furthermore, the stock has carved an impulse Wave 1 Grey lower towards 142 and is unfolding potential Wave 2 Grey at the time of writing.
The stock terminated its Intermediate Wave (4) Orange around 83 mark in June 2022. Since then, the rally can be sub divided in Minor Waves 1 through 5, which completed around 185 highs. Minor Wave 2 unfolded as a combination while Wave 3 was extended.
If the above proposed wave structure holds well, TATA Steel is progressing within a counter trend zigzag at Minor degree at least. Also note that Minor Wave 1 is in place around 142 while Minor Wave 2 is either complete at 155 or could extend through 170 mark.
TATA Steel Elliott Wave technical analysis
Function: Counter Trend (Minor degree, Grey).
Mode: Corrective.
Structure: Impulse within Larger degree Zigzag.
Position: Minor Wave 2 Grey.
Details: Major top might be in place at 185 mark. Further the stock has dropped as an impulse to 142, terminating potential Minor Wave 1 Grey. Wave 2 Grey also could be complete just below 160 mark; if correct Wave 3 Grey is now underway. Alternatively, Wave 2 Grey might still push through 170 levels within a Minuette (a)-(b)-(c) orange.
Invalidation point: 185
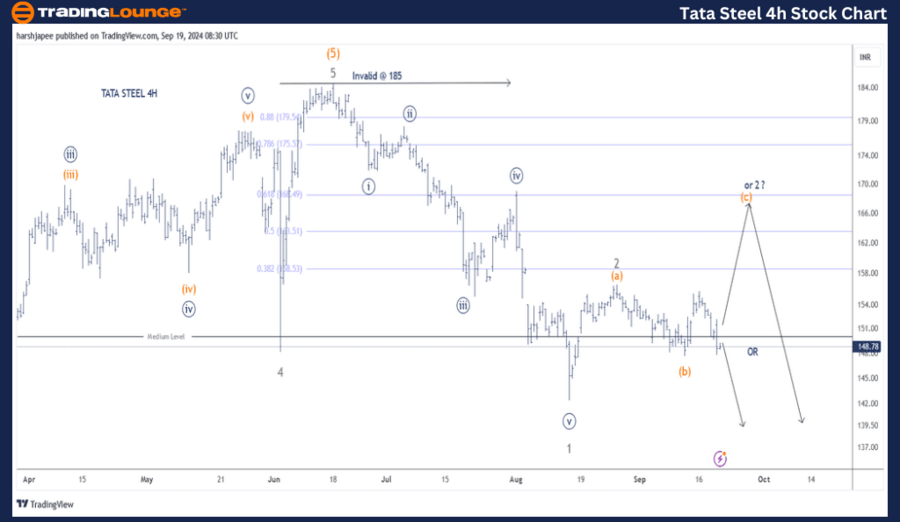
TATA Steel four-hour chart technical analysis and potential Elliott Wave counts
TATA Steel 4H chart reveals the recent wave count since 185 high registered in June 2024. The stock has unfolded an impulse through 142, terminating Minor Wave 1 Grey and is now progressing within Minor Wave 2 Grey. If correct, Minor Wave 3 Grey should be underway soon.
Conclusion
TATA Steel is progressing within a counter trend Minor Wave 2 Grey, which could extend through 170 levels. The stock should then turn lower as Minor Wave 3 Grey resumes.
Tata Steel Elliott Wave technical analysis [Video]
Author

Peter Mathers
TradingLounge
Peter Mathers started actively trading in 1982. He began his career at Hoei and Shoin, a Japanese futures trading company.