Tata Motors Stock News and Forecast: TTM set for chart break lower
- Tata Motors stock recovery begins to run out of power.
- NYSE:TTM breaks above the key 200-day moving average but stalls.
- Tata Motors stock is still short of a large consolidation phase.

TATA Motors stock (TTM) is still trying to maintain its recent bullish momentum, but the main technical indicators show that it is beginning to lose momentum. Tata Motors is a large conglomerate that owns such brands as Jaguar and Land Rover. It is one of India's largest companies and is engaged in competition with global automakers and now also from electric vehicle stocks such as Tesla (TSLA) and Rivian (RIVN).
Tata Motors Stock News
In line with surging prices for global commodities, Tata Motors last week announced a price hike for commercial vehicles, effective from April 1.
"While the company has initiated actions to absorb a significant portion of the increased costs, at various levels of manufacturing, the steep rise in overall input costs makes it imperative to pass on some residual proportion via a minimized price hike," wrote management in a statement.
Tata Motors stock rose on the back of the price hikes in direct contrast to some competitors who saw stock prices fall when they made similar announcements. Economics 101 teaches us that demand falls as prices rise. Further price hikes cannot be ruled out across the Tata Motors range as commodity prices remain elevated and show no signs of falling. Added to this are concerns about global supply chains, semiconductor chip issues, and the surging price of oil.
Online searches for electric vehicles have surged, and regular petro and diesel-powered cars are seeing sharp price falls in second-hand markets already. By contrast, the price of electric vehicles in second-hand markets is soaring. Tesla (TSLA) recently began asking Chinese customers making multiple purchases not to resell vehicles for a year in an attempt to curb profits in the soaring second-hand market.
Tata Motors Stock Forecast
We can see why TTM struggled and eventually fell back to find welcome support from the 200-day moving average. A long period of consolidation followed the breakout in October 2021. Usually, a consolidation phase is a continuation trend, so a breakout to the top of our highlighted zone should have taken place. However, failure to break $530 meant the trend lacked conviction. February 24 finally saw a powerful break lower, breaking the bottom of the zone at 460. Tata Motors stock broke sharply before eventually finding some support at the 200-day moving average.
This has served to stabilize losses, but the longer-term trend still points lower. The volume profile bars to the right of our chart show the lack of price acceptance at current levels. Back to $300 is most likely as volume is strong here, so this should act as strong support and the medium-term target. Strong resistance is at $460.
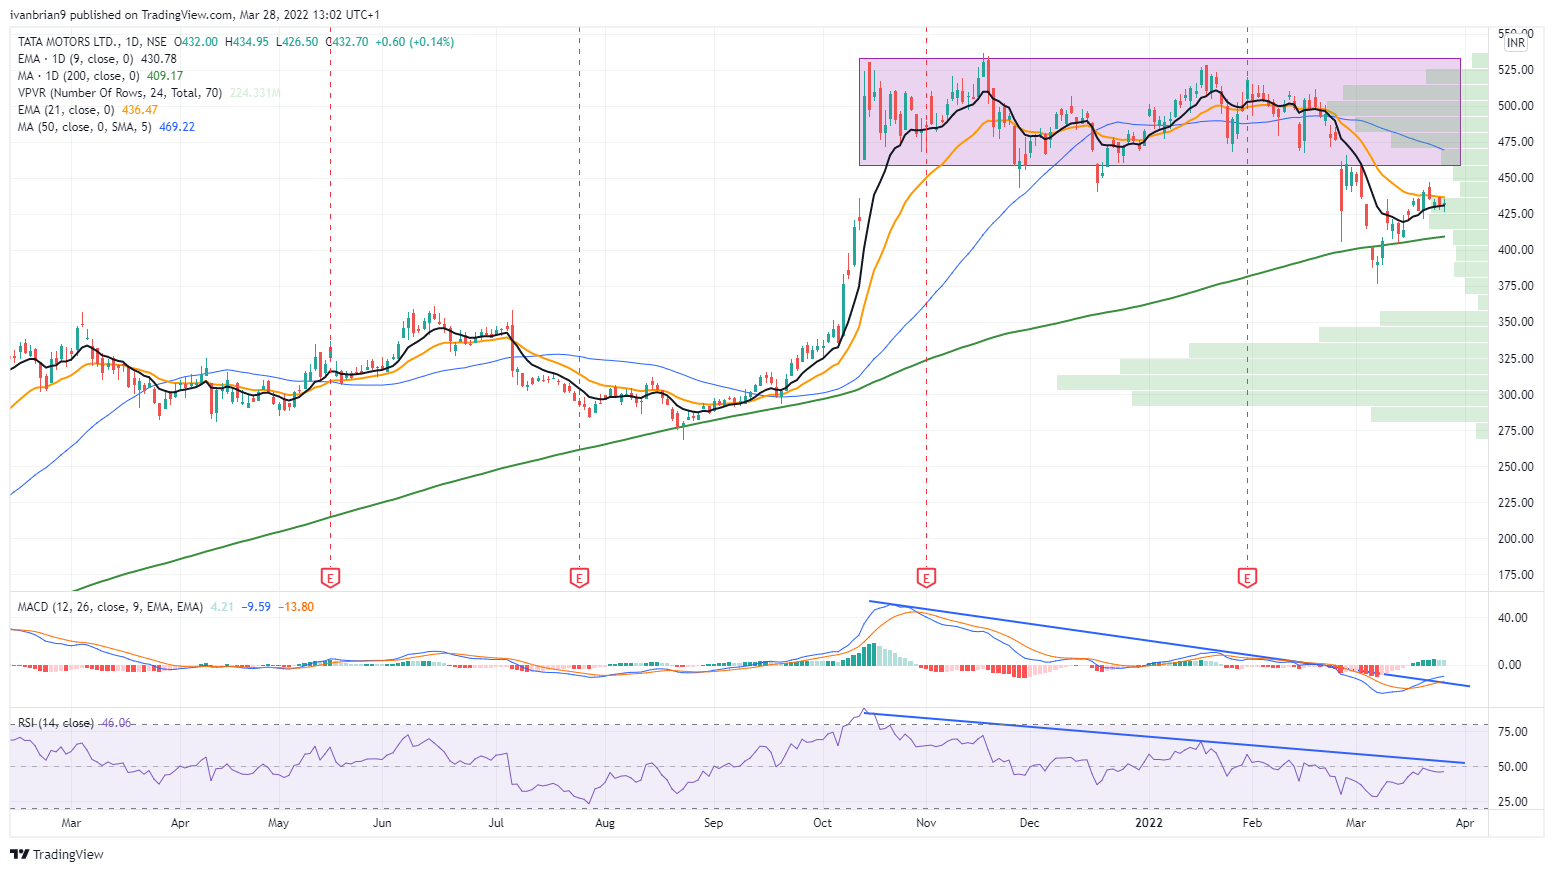
Tata Motors stock chart, daily
For those taking a more short-term view, look to key support at $427.80, shown in the 15-minute chart below.
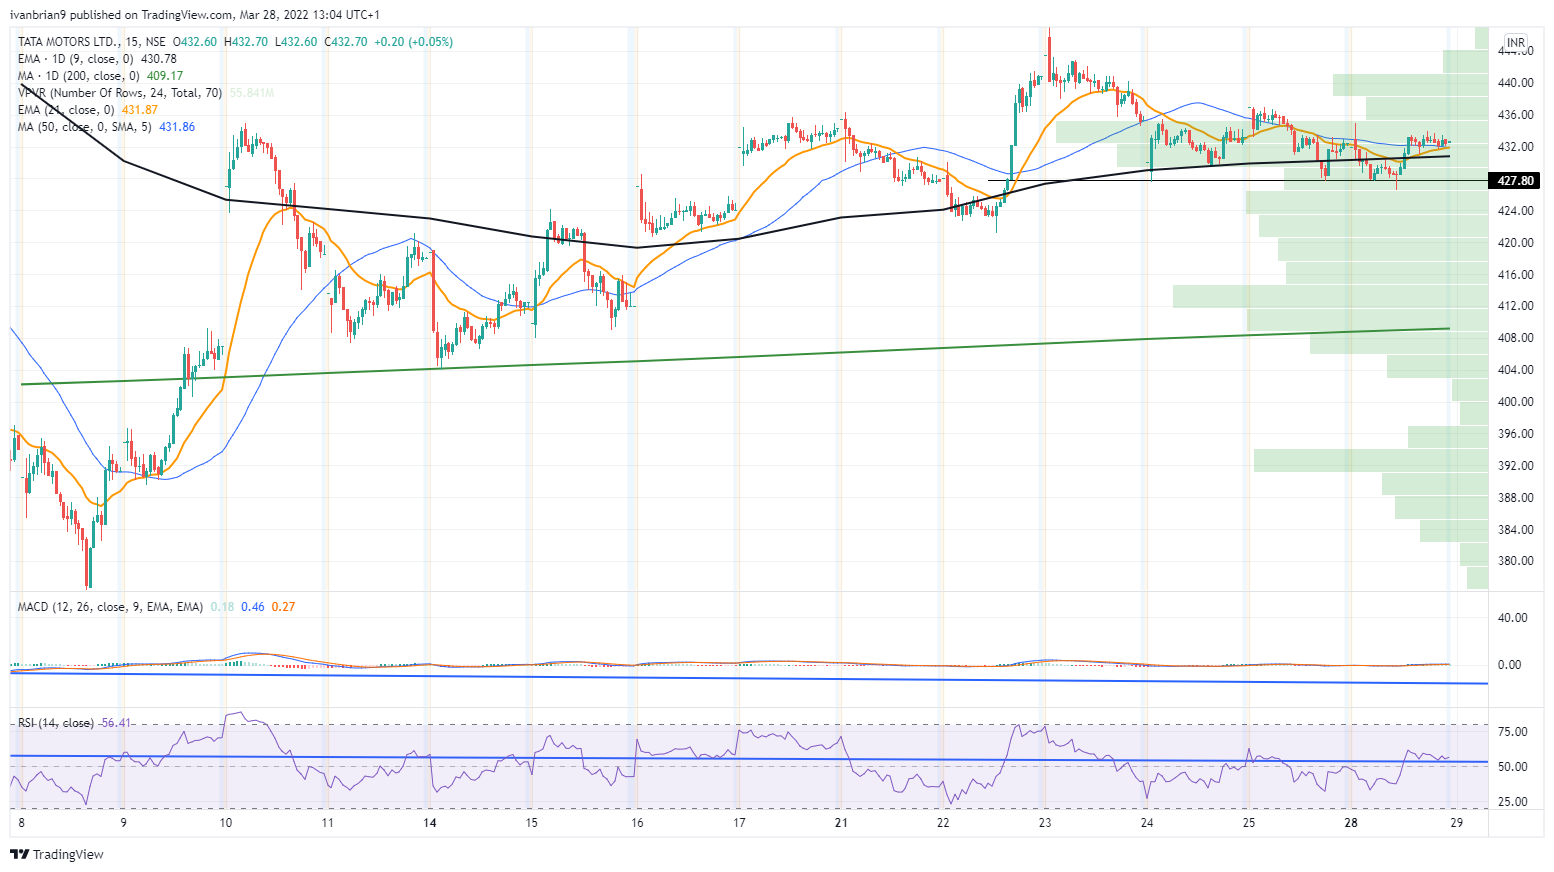
Tata Motors chart, 15-minute
Premium
You have reached your limit of 3 free articles for this month.
Start your subscription and get access to all our original articles.
Author

Ivan Brian
FXStreet
Ivan Brian started his career with AIB Bank in corporate finance and then worked for seven years at Baxter. He started as a macro analyst before becoming Head of Research and then CFO.