TASI index Elliott Wave technical analysis [Video]
![TASI index Elliott Wave technical analysis [Video]](https://editorial.fxstreet.com/images/Markets/Equities/DowJones/dow-jones-industrial-average-23489884_XtraLarge.jpg)
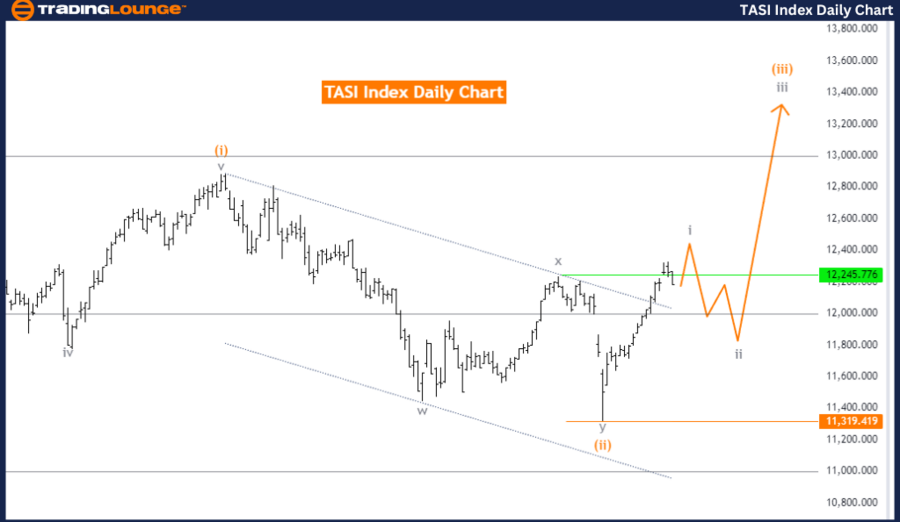
TASI Index Elliott Wave Analysis Trading Lounge Day Chart.
TASI index Elliott Wave technical analysis
Function: Bullish Trend.
Mode: Impulsive.
Structure: Gray wave 1.
Position: Orange wave 3.
Direction next lower degrees: Gray wave 2.
Details: Orange wave 2 completed, now gray wave 1 of orange wave 3 is in play.
Wave cancel invalid level: 11319.419.
The TASI Index currently shows a bullish trend based on Elliott Wave analysis on the daily chart. The market is in an impulsive mode, typically indicating strong movement in the direction of the prevailing trend. The primary structure under review is gray wave 1, with the current position marked as orange wave 3. This indicates the market is in the third wave of the orange wave sequence, often the most powerful and extended wave in an Elliott Wave cycle.
The analysis reveals that orange wave 2 has concluded, and gray wave 1 of orange wave 3 is now active. This suggests the market has moved beyond the corrective phase (orange wave 2) and is now in the early stages of a new impulsive wave (gray wave 1 within orange wave 3). The development of gray wave 1 suggests increasing market momentum, with potential continued upward movement as the wave progresses.
The direction for the next lower degrees indicates that after gray wave 1 completes, the market might enter gray wave 2, a minor corrective phase within the broader impulsive movement of orange wave 3. However, the current focus remains on the progression of gray wave 1, which is expected to continue pushing the market higher.
A critical level to watch is 11319.419, identified as the wave cancel invalid level. If the market reaches or drops below this level, it would invalidate the current wave structure, potentially signaling a change in market conditions or the need to re-evaluate the wave count.
In summary, the TASI Index is currently in a bullish phase on the daily chart, with the market positioned in gray wave 1 of orange wave 3. The key level to monitor for invalidation of this wave structure is 11319.419.
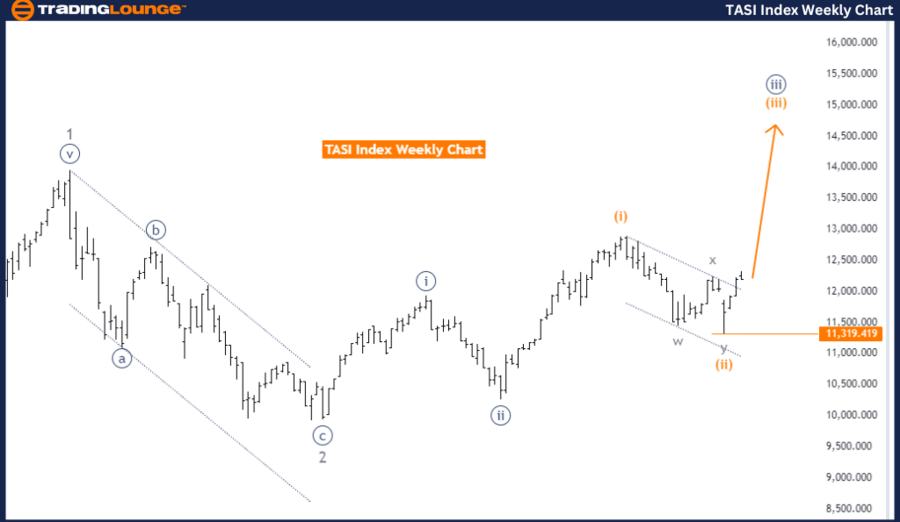
TASI Index Elliott Wave Analysis Trading Lounge Weekly Chart.
TASI index Elliott Wave technical analysis
Function: Bullish Trend.
Mode: Impulsive.
Structure: Orange wave 3.
Position: Navy Blue Wave 3.
Direction next lower degrees: Orange wave 3 (continue).
Details: Orange wave 2 of 3 appears completed, now orange wave 3 is in play.
Wave cancel invalid level: 11319.419.
The TASI Index is currently displaying a bullish trend according to Elliott Wave analysis on the weekly chart. The market is in an impulsive mode, signaling strong upward movement within the broader trend. The primary structure under analysis is orange wave 3, with the current position identified as navy blue wave 3 within this structure. This indicates that the market is in the third wave of the navy blue wave sequence, which generally represents a strong and extended phase in an Elliott Wave cycle.
The analysis suggests that orange wave 2 of 3 has likely concluded, meaning the market has passed through a corrective phase and is now advancing within orange wave 3. The completion of Orange Wave 2 sets the stage for the continuation of the bullish trend as Orange Wave 3 progresses. This phase is expected to drive the market higher, reflecting strong momentum and further gains within the ongoing trend.
The direction for the next higher degrees confirms that orange wave 3 is anticipated to continue, reinforcing the bullish outlook for the market. This ongoing wave indicates that the upward movement is not yet complete, with further market advancements expected as the wave unfolds.
A critical level to monitor is 11319.419, identified as the wave cancel invalid level. If the market were to drop to or below this level, it would invalidate the current wave structure, potentially signaling a reversal or the need to re-evaluate the Elliott Wave count.
In summary, the TASI Index is in a bullish phase on the weekly chart, currently progressing through navy blue wave 3 within orange wave 3. The key level to watch for potential invalidation of this wave structure is 11319.419.
Technical analyst: Malik Awais.
TASI Index Elliott Wave technical analysis [Video]
Author

Peter Mathers
TradingLounge
Peter Mathers started actively trading in 1982. He began his career at Hoei and Shoin, a Japanese futures trading company.


