TASI Elliott Wave technical analysis [Video]
![TASI Elliott Wave technical analysis [Video]](https://editorial.fxstreet.com/images/Markets/Equities/display-panel-of-daily-stock-market-59908972_XtraLarge.jpg)
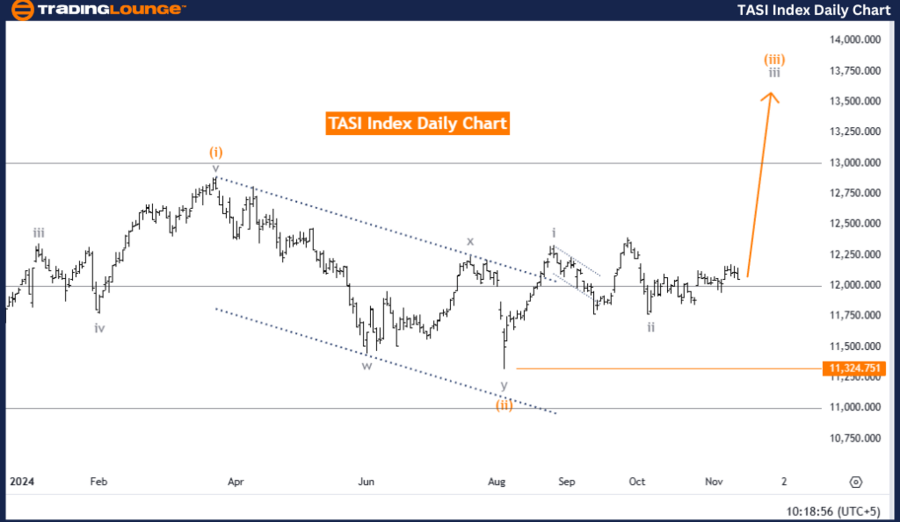
TASI Index Elliott Wave Analysis Trading Lounge day chart.
TASI Elliott Wave technical analysis
-
Function: Bullish Trend.
-
Mode: Impulsive.
-
Structure: Gray wave 3.
-
Position: Orange wave 3.
-
Direction next lower degrees: Gray wave 4.
-
Details: Gray wave 2 is complete. Gray wave 3 is now active.
-
Wave cancel invalid level: 11324.751.
The Elliott Wave analysis for the TASI Index daily chart from Trading Lounge highlights a bullish trend, with the current movement following an impulsive wave pattern. Gray wave 3 is identified as the primary wave in progress, indicating strong upward momentum. Positioned within orange wave 3, this structure aligns with a broader bullish perspective, reflecting continued positive sentiment in the TASI Index.
The completion of gray wave 2 has paved the way for gray wave 3 to develop. Wave 3 is typically characterized by the strongest and most sustained momentum in the Elliott Wave cycle. The current position of gray wave 3 within orange wave 3 further supports the bullish outlook, with expectations for continued price increases as gray wave 3 unfolds.
A critical invalidation level is set at 11324.751, serving as a key reference point for the wave structure. If the TASI Index drops to or below this level, the current Elliott Wave analysis would be invalidated, indicating that the bullish trend may not persist. This could suggest a shift in market direction or the beginning of a corrective phase, necessitating a re-evaluation of the wave structure.
Summary
The analysis supports a bullish outlook for the TASI Index, with gray wave 3 actively driving the upward trend within the framework of orange wave 3. Traders should closely watch movements near the invalidation level at 11324.751, as a break below this point could challenge the bullish trend, signaling a potential reversal or correction. This level is a critical benchmark for assessing the integrity of the ongoing bullish structure.
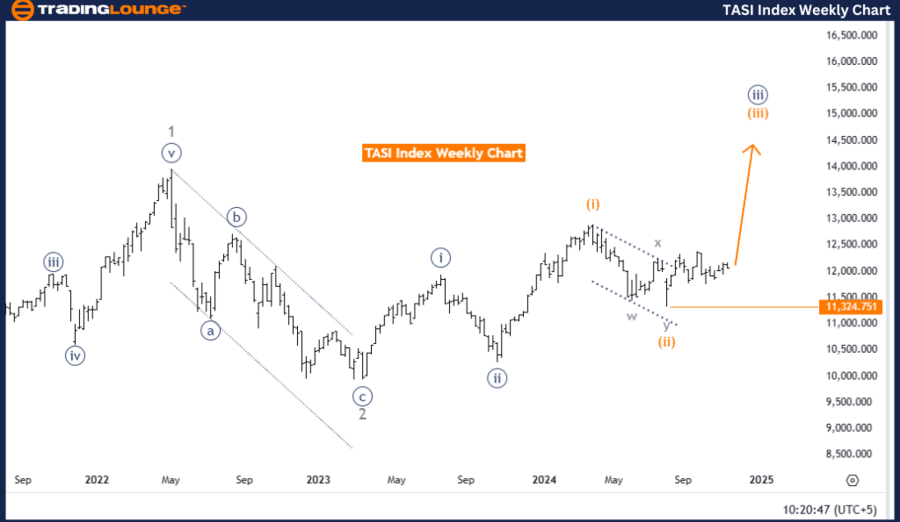
TASI Index Elliott Wave Analysis Trading Lounge weekly chart.
TASI Elliott Wave technical analysis
-
Function: Bullish Trend.
-
Mode: Impulsive.
-
Structure: Orange wave 3.
-
Position: Navy blue wave 3.
-
Direction next lower degrees: Orange wave 4.
-
Details: Orange wave 2 is complete. Orange wave 3 is now active.
-
Wave cancel invalid level: 11324.751.
The Elliott Wave analysis for the TASI Index weekly chart from Trading Lounge reflects a bullish trend, driven by an impulsive wave structure. Orange wave 3 is currently developing within the broader navy blue wave 3 framework, signaling strong upward momentum. The impulsive nature of this wave structure supports a sustained positive outlook, with potential for additional gains as orange wave 3 progresses.
The completion of orange wave 2 has set the stage for the advancement of orange wave 3, which is a critical phase within the Elliott Wave cycle. Wave 3 typically represents the strongest and most dynamic movement in the trend, often characterized by significant upward price action. The alignment within navy blue wave 3 further reinforces the bullish outlook, suggesting continued positive momentum.
A vital invalidation level is set at 11324.751, acting as a key point of reference for this analysis. Should the index fall to or below this level, the current wave structure would be invalidated, potentially indicating a trend shift or the start of a corrective phase. This level serves as a benchmark for traders to evaluate the strength and sustainability of the current bullish trend.
Summary
This analysis indicates a bullish trajectory for the TASI Index, with orange wave 3 driving the upward trend as part of the larger navy blue wave 3 structure. Traders are advised to observe the index closely concerning the invalidation level at 11324.751. A decline below this threshold could signal a possible reversal or a need to reassess the trend structure. This level is critical for validating the continuation and strength of the ongoing bullish movement.
TASI Elliott Wave technical analysis [Video]
Author

Peter Mathers
TradingLounge
Peter Mathers started actively trading in 1982. He began his career at Hoei and Shoin, a Japanese futures trading company.


