TASI Elliott Wave technical analysis [Video]
![TASI Elliott Wave technical analysis [Video]](https://editorial.fxstreet.com/images/Markets/Equities/Industries/Software/software-code-637435356353853480_XtraLarge.jpg)
TASI index Elliott Wave technical analysis
-
Function: Trend.
-
Mode: Impulsive.
-
Structure: Gray wave 3.
-
Position: Orange wave 3.
-
Next lower degrees: Gray wave 4.
-
Details: Gray wave 2 completed, gray wave 3 in progress.
-
Wave invalidation level: 11345.065.
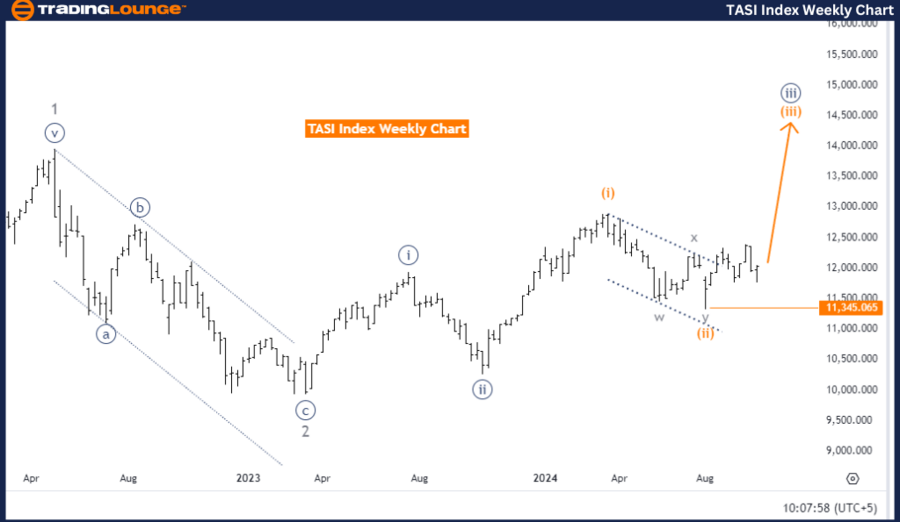
The daily Elliott Wave analysis of the TASI Index indicates the continuation of an impulsive trend, currently in gray wave 3. The overall structure suggests a bullish movement, with gray wave 2 already completed, and the market now advancing through gray wave 3. This analysis implies that the upward trend is likely to persist as part of a larger impulsive move.
Within this wave count, the current position is in orange wave 3, which is a sub-wave of gray wave 3. This phase marks a strong upward push, following the completion of the earlier corrective phase (gray wave 2). The market is expected to continue rising until gray wave 3 completes, at which point it will transition into the next corrective phase, gray wave 4.
For now, the upward trend remains dominant as gray wave 3 is still active. However, if the market price drops below the invalidation level of 11345.065, the current wave structure will be invalidated, and a reevaluation of the market direction will be necessary. Until then, the bullish wave scenario continues to hold.
Summary:
-
The TASI Index is in an impulsive bullish trend.
-
Gray wave 3 is currently in progress, following the completion of gray wave 2.
-
Orange wave 3 is pushing the market higher.
-
The bullish trend is valid as long as the market remains above the invalidation level of 11345.065.
TASI index Elliott Wave technical analysis
-
Function: Trend.
-
Mode: Impulsive.
-
Structure: Orange wave 3.
-
Position: Navy Blue Wave 3.
-
Next lower degrees: Orange wave 4.
-
Details: Orange Wave 2 completed, Orange Wave 3 in progress.
-
Wave invalidation level: 11345.065.
The weekly Elliott Wave analysis of the TASI Index indicates the continuation of an impulsive trend, with orange wave 3 currently in progress. The overall structure points to a bullish movement, as orange wave 2 has been completed and the market is advancing through orange wave 3. This phase of the wave count suggests strong upward momentum, as wave 3 typically represents a significant portion of a trending move within the Elliott Wave structure.
At present, the market is progressing through navy blue wave 3, a sub-wave of the larger orange wave 3. The completion of orange wave 2 has set the stage for this upward movement, with orange wave 3 now driving the market higher. Once orange wave 3 completes, the market is expected to transition into orange wave 4, which will represent the next corrective phase of this trend. However, the market remains in an impulsive upward phase for now.
The invalidation level for this wave count is 11345.065. A drop below this level would invalidate the current wave structure, signaling that the impulsive wave scenario may no longer be valid. As long as the market remains above this level, the bullish trend driven by orange wave 3 is expected to continue.
Summary:
-
The TASI Index is in an impulsive trend on the weekly chart.
-
Orange wave 3 is currently active after the completion of orange wave 2.
-
The market is advancing through navy blue wave 3.
-
The bullish trend is expected to persist until orange wave 3 completes.
-
The trend remains valid as long as the market stays above the invalidation level of 11345.065.
Technical analyst: Malik Awais.
TASI index Elliott Wave technical analysis [Video]
Author

Peter Mathers
TradingLounge
Peter Mathers started actively trading in 1982. He began his career at Hoei and Shoin, a Japanese futures trading company.


