Swiss Market Index Elliott Wave technical analysis [Video]
![Swiss Market Index Elliott Wave technical analysis [Video]](https://editorial.fxstreet.com/images/Markets/Equities/DowJones/dow-jones-stock-indexes-7184580_XtraLarge.jpg)
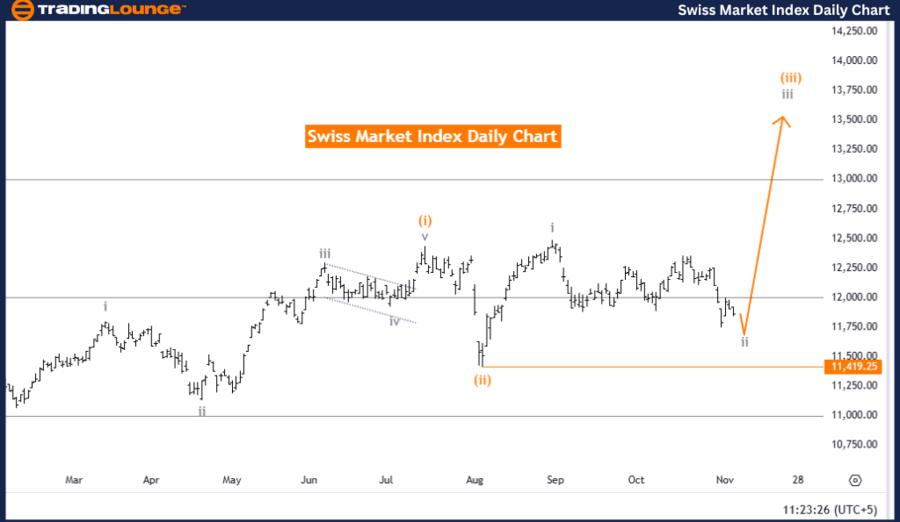
Swiss Market Index (SMI) Day Chart Analysis.
Elliott Wave Analysis for SMI - Day Chart.
Index: Swiss Market Index (SMI).
Chart focus: Elliott Wave technical analysis
-
Function: Counter Trend.
-
Mode: Corrective.
-
Wave structure: Gray Wave 2.
-
Position: Within Orange Wave 3.
-
Direction for next higher degree: Transition to Gray Wave 3.
-
Details: Gray Wave 1 has completed, and Gray Wave 2 is nearing its end.
Current SMI Elliott Wave overview
The daily Elliott Wave analysis of the Swiss Market Index indicates an ongoing counter-trend correction phase in gray wave 2 following the completion of gray wave 1. This current phase is in corrective mode, with orange wave 3 positioned within the structure and aligning toward a broader movement toward gray wave 3, the anticipated higher-degree bullish trend.
Gray wave 2 represents a corrective stage after the previous upward movement and is close to completion. This phase suggests that the SMI may soon transition back to an upward trajectory, potentially beginning gray wave 3. The wave cancel invalid level is at 11,419.25; a move below this threshold would invalidate the current corrective wave structure and could indicate a shift from the anticipated trend continuation.
Key levels and immediate trend focus
The primary focus is on the approaching end of gray wave 2, which could transition into gray wave 3 and resume the upward movement. Traders may watch for signs of this shift near the invalidation level of 11,419.25, as staying above this level supports the bullish outlook.
Summary
In summary, the SMI is currently in a corrective gray wave 2 phase, with gray wave 1 previously completed. The next major phase is expected to be gray wave 3, pointing to a potential return to a bullish trend. The invalidation level at 11,419.25 remains critical; any breach of this level could negate the current wave structure and signal a possible trend shift. The market is monitoring the conclusion of gray wave 2, anticipating a resumption of the upward trend if the corrective structure holds.
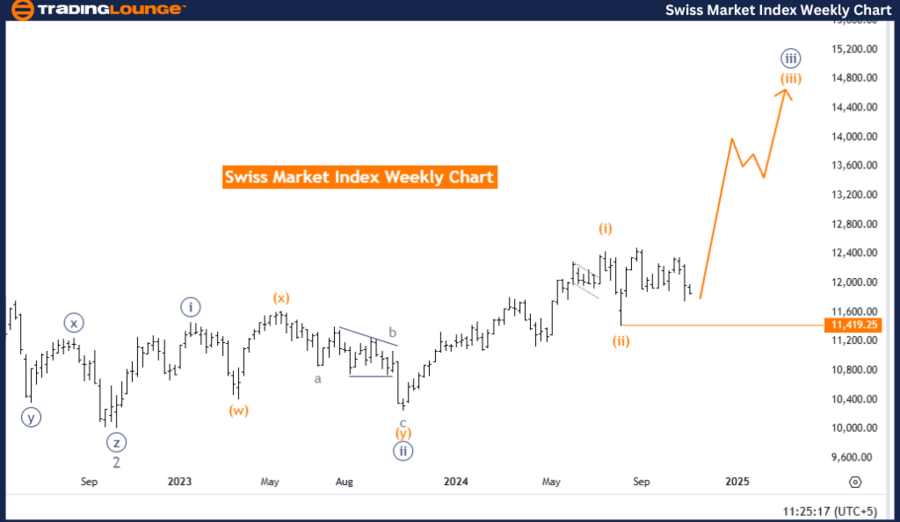
Swiss Market Index (SMI) Weekly Chart Analysis.
Elliott Wave Analysis for SMI - Weekly Chart.
Index: Swiss Market Index (SMI).
Chart focus: Elliott Wave technical analysis
-
Function: Bullish Trend.
-
Mode: Impulsive.
-
Wave structure: Orange Wave 3.
-
Position: Within Navy Blue Wave 3.
-
Direction for next higher degree: Ongoing Orange Wave 3.
-
Details: Orange Wave 2 has completed, and Orange Wave 3 is currently in progress.
Current SMI Elliott Wave overview
The weekly Elliott Wave analysis for the Swiss Market Index reflects a bullish trend in an impulsive phase, centered on orange wave 3 after completing orange wave 2. Within this advancing trend, navy blue wave 3 aligns with the momentum in orange wave 3, supporting a continued bullish outlook for the SMI.
This phase in orange wave 3 suggests sustained upward momentum as part of the broader bullish trend. With orange wave 2 complete, the SMI is anticipated to continue its advance in the impulsive phase of orange wave 3, reflecting a strong bullish trend in line with higher-degree wave analysis. The wave cancel invalid level at 11,419.25 is crucial to monitor; any movement below this threshold would invalidate the current wave structure and imply a potential shift from the bullish trend.
Key levels and immediate trend focus
With orange wave 3 active, traders and investors may focus on signals of sustained upward momentum. Holding above the 11,419.25 invalidation level reinforces the bullish structure, supporting potential continued gains in navy blue wave 3.
Summary
In summary, the SMI is advancing within the impulsive phase of orange wave 3, following the completion of orange wave 2. This bullish trend’s continuation depends on maintaining levels above the critical invalidation threshold of 11,419.25. The analysis suggests a positive outlook, expecting further upward movement as the SMI progresses within its current bullish structure.
Technical analyst: Malik Awais.
Chart focus: Elliott Wave technical analysis [Video]
Author

Peter Mathers
TradingLounge
Peter Mathers started actively trading in 1982. He began his career at Hoei and Shoin, a Japanese futures trading company.


