Swiss Market Index Elliott Wave technical analysis [Video]
![Swiss Market Index Elliott Wave technical analysis [Video]](https://editorial.fxstreet.com/images/Markets/Equities/Nasdaq/new-york-stock-exchange-18404353_XtraLarge.jpg)
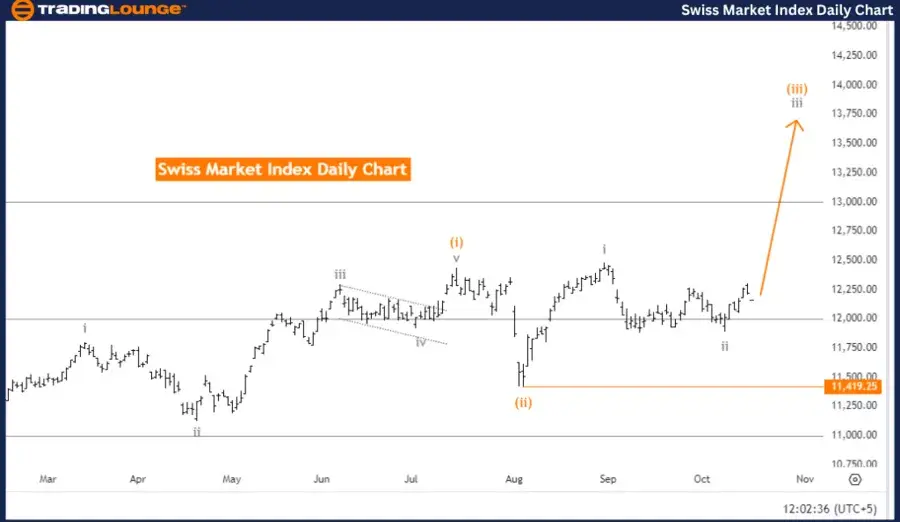
Swiss Market Index Elliott Wave Analysis Trading Lounge Day Chart.
Swiss Market Index Elliott Wave technical analysis
-
Function: Trend.
-
Mode: Impulsive.
-
Structure: Gray wave 3.
-
Position: Orange wave 3.
-
Direction next higher degrees: Gray wave 3 (started).
-
Details: Gray wave 2 has been completed, and gray wave 3 is now in play.
-
Wave cancel invalid level: 11,419.25.
The Swiss Market Index (SMI) Elliott Wave analysis for the daily chart indicates that the market is experiencing a bullish trend with an impulsive wave structure. The current analysis focuses on gray wave 3, which is advancing within the broader trend. The market is in the middle of orange wave 3, forming part of the ongoing gray wave 3.
Previously, gray wave 2 was completed, and attention is now on the continued progress of gray wave 3. The impulsive nature of this wave signals strong upward momentum, with further gains anticipated as the wave unfolds. Impulsive waves like this are typically associated with significant and sustained price movements in the direction of the prevailing trend.
The invalidation level for this wave structure is set at 11,419.25. If the price falls below this level, the current Elliott Wave count will be invalidated, necessitating a reassessment of the wave structure. However, as long as the price remains above this invalidation level, gray wave 3 is expected to continue pushing the market higher.
Summary: The Swiss Market Index is currently in the midst of a strong upward trend, with gray wave 3 progressing. The completion of gray wave 2 has laid the groundwork for further gains, as orange wave 3 unfolds within the larger wave structure. The next significant phase involves the continuation of gray wave 3, with the key invalidation level to monitor set at 11,419.25, below which the wave count would need to be reconsidered.
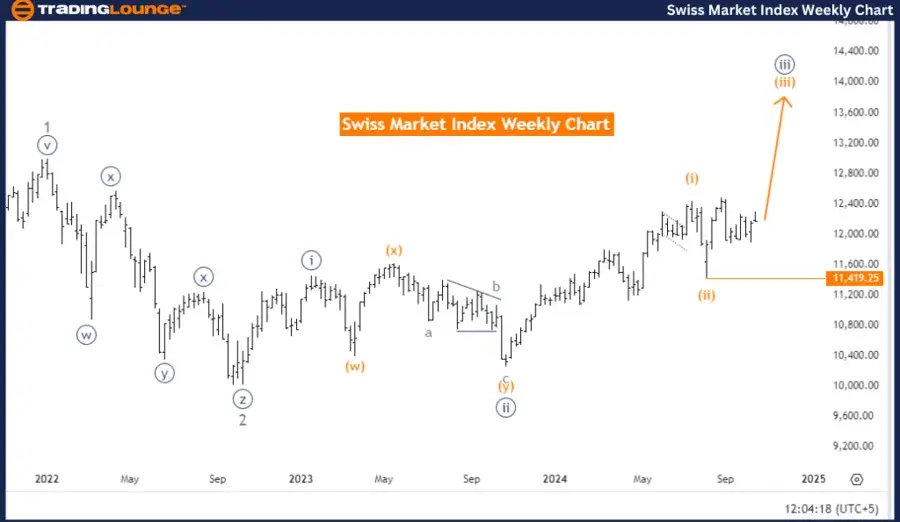
Swiss Market Index Elliott Wave Analysis Trading Lounge Weekly Chart.
Swiss Market Index Elliott Wave technical analysis
-
Function: Bullish Trend.
-
Mode: Impulsive.
-
Structure: Orange wave 3.
-
Position: Navy Blue Wave 3.
-
Direction next higher degrees: Orange wave 3 (started).
-
Details: Orange Wave 2 has completed, and now Orange Wave 3 is in play.
-
Wave cancel invalid level: 11,419.25.
The Swiss Market Index (SMI) weekly chart Elliott Wave analysis highlights a bullish trend, following an impulsive wave structure. The primary focus is on the ongoing orange wave 3, which is currently pushing the market higher within the broader trend framework. This suggests a continuation of the upward movement in line with the long-term bullish outlook.
Previously, orange wave 2 was completed, and the market is now advancing through orange wave 3. The impulsive nature of this wave signals strong momentum, suggesting that the bullish trend is set to continue. This is a pivotal phase in the Elliott Wave cycle, during which substantial upward price movements are expected.
The analysis also identifies that the market is positioned within navy blue wave 3, which is part of the overall wave structure, pointing towards further advances. The next focus is the continuation of orange wave 3, which has already started and is expected to push the market even higher as it unfolds.
The invalidation level for this wave structure is set at 11,419.25. If the market drops below this level, the current wave count would be invalidated, requiring a reassessment of the analysis. However, as long as the price remains above this key level, the bullish outlook is likely to hold, with further upward movement anticipated in line with orange wave 3.
Summary: The Swiss Market Index is currently in the midst of a strong bullish trend, driven by orange wave 3. Orange wave 2 has completed, and the continuation of the upward movement in orange wave 3 is now underway. The critical level to monitor is 11,419.25, as a drop below this point would invalidate the current Elliott Wave structure.
Technical analyst: Malik Awais.
Swiss Market Index Elliott Wave technical analysis [Video]
Author

Peter Mathers
TradingLounge
Peter Mathers started actively trading in 1982. He began his career at Hoei and Shoin, a Japanese futures trading company.


