Swiss Market Index Elliott Wave technical analysis [Video]
![Swiss Market Index Elliott Wave technical analysis [Video]](https://editorial.fxstreet.com/images/TechnicalAnalysis/ChartPatterns/PointFigure/stock-market-performance-9668321_XtraLarge.jpg)
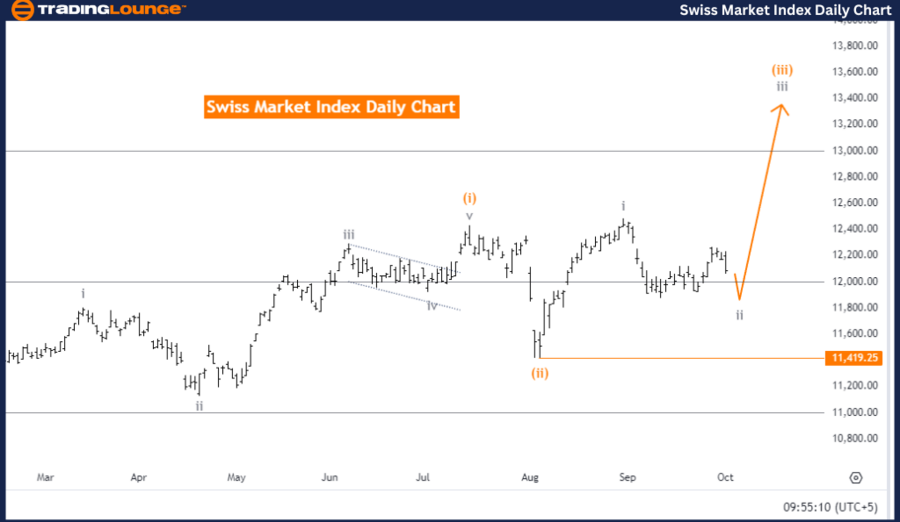
Swiss Market Index Elliott Wave Analysis Trading Lounge day chart
Swiss Market Index Elliott Wave technical analysis
Function: Counter Trend.
Mode: Corrective.
Structure: Gray wave 2.
Position: orange wave 3.
Direction next higher degrees: Gray wave 3.
Details: Gray wave 1 has been completed, and now gray wave 2 is in play.
Wave cancel invalid level: 11,419.25.
The Swiss Market Index (SMI) Elliott Wave Analysis for the daily chart indicates a counter-trend movement, suggesting that the market is currently undergoing a correction against the main trend. The mode of this movement is corrective, implying that this phase is a temporary retracement rather than a continuation of the larger trend. The structure being analyzed is gray wave 2, which follows the completion of gray wave 1.
At this stage, the market is positioned in orange wave 3 within the overall corrective structure of gray wave 2. Gray wave 1 has already been completed, and now gray wave 2 is in progress. In Elliott Wave Theory, wave 2 typically corrects part of wave 1's movement, meaning the market is temporarily retracing some of the gains made during gray wave 1. This suggests that the current counter-trend phase is not expected to last indefinitely and that the larger trend will likely resume once gray wave 2 completes.
The next higher-degree movement expected is gray wave 3, which should follow the completion of gray wave 2. Wave 3 is usually an impulsive wave, marking a strong and sustained move in the direction of the main trend. This indicates that after the current corrective phase, the market is likely to experience a more significant upward movement.
A crucial invalidation level for this analysis is 11,419.25. If the market falls below this point, the current Elliott Wave analysis would be invalid, meaning that the counter-trend structure would no longer hold, and a new wave analysis would be needed. Monitoring this level is essential for traders.
In summary, the SMI Elliott Wave Analysis shows a corrective counter-trend phase with gray wave 2 in progress. Traders should watch the invalidation level of 11,419.25 to determine if the corrective phase remains valid. Once gray wave 2 completes, gray wave 3 is expected to resume the primary trend.
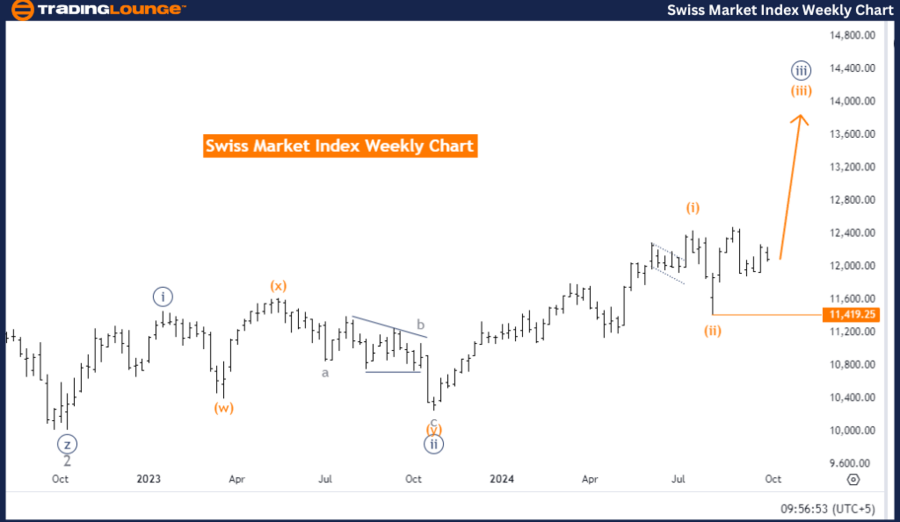
Swiss Market Index Elliott Wave analysis Trading Lounge weekly chart.
Swiss Market Index Elliott Wave technical analysis
Function: Bullish Trend.
Mode: Impulsive.
Structure: Orange wave 3.
Position: Navy blue wave 3.
Direction next higher degrees: Orange wave 3 (started).
Details: Orange wave 2 has been completed, and now orange wave 3 is in play.
Wave cancel invalid level: 11,419.25.
The Swiss Market Index (SMI) Elliott Wave Analysis for the weekly chart shows a bullish trend, indicating strong upward momentum in the market. The current mode is impulsive, meaning the market is moving decisively in the direction of the trend. The structure being analyzed is orange wave 3, which is a key part of this ongoing bullish movement.
The market is currently positioned in navy blue wave 3, within the larger framework of orange wave 3. Following the completion of orange wave 2, orange wave 3 has now begun. In Elliott Wave Theory, wave 3 is typically the most powerful and extended wave in an impulsive sequence, suggesting that the market is poised for significant upward movement as orange wave 3 progresses. This upward momentum is likely to continue as wave 3 tends to drive strong trends.
The next anticipated movement will be a continuation of orange wave 3, as it has just started. Since wave 3 is generally a strong, trend-defining phase, further gains are expected before any corrective waves might occur.
The invalidation level to watch is 11,419.25. If the market falls below this level, the current Elliott Wave analysis would be invalid, and a reassessment of the wave structure would be necessary. This level is critical for confirming the validity of the ongoing bullish trend.
In summary, the SMI Elliott Wave Analysis for the weekly chart signals a strong bullish trend, with orange wave 3 leading the market higher. Traders should monitor the invalidation level of 11,419.25 closely, as staying above this level confirms the strength of the upward movement. The bullish momentum is expected to persist as orange wave 3 continues to unfold.
Swiss Market Index Elliott Wave technical analysis [Video]
Author

Peter Mathers
TradingLounge
Peter Mathers started actively trading in 1982. He began his career at Hoei and Shoin, a Japanese futures trading company.


