Swiss Market Index Elliott Wave technical analysis [Video]
![Swiss Market Index Elliott Wave technical analysis [Video]](https://editorial.fxstreet.com/images/TechnicalAnalysis/ChartPatterns/Candlesticks/digital-tablet-with-stock-charts-30235834_XtraLarge.jpg)
Swiss Market Index Elliott Wave technical analysis
-
Function: Counter Trend.
-
Mode: Corrective.
-
Structure: Gray Wave 2.
-
Position: Orange Wave 3.
-
Direction next higher degrees: Gray Wave 3.
-
Details: Gray Wave 1 completed, now Gray Wave 2 is in progress.
-
Wave cancel invalid level: 11,419.25.
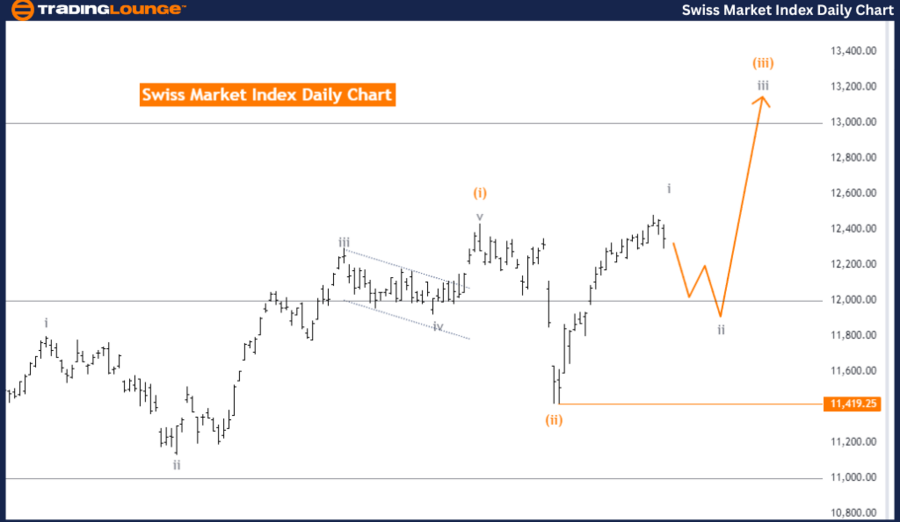
The Swiss Market Index is currently in a counter-trend phase according to Elliott Wave analysis on the Day Chart. The market mode is corrective, indicating that the market is in a retracement or correction phase rather than following a continuous trend. The current structure is identified as Gray Wave 2, which forms part of a larger corrective pattern.
In terms of wave position, the market has completed Gray Wave 1. Now, it is forming Gray Wave 2, which represents the ongoing retracement phase. The completion of Gray Wave 1 has set the stage for Gray Wave 2 to develop further.
The next move for higher degrees is expected to be Gray Wave 3, which will follow the completion of Gray Wave 2. This upcoming wave is anticipated to resume the broader trend after the corrective phase concludes. Understanding the development of Gray Wave 2 is crucial to anticipate the transition to Gray Wave 3.
A key aspect of this analysis is the wave cancel invalidation level, set at 11,419.25. If the market reaches or exceeds this level, it would invalidate the current Elliott Wave count, meaning that the expected wave structure would no longer be valid. This invalidation level serves as an important marker for determining the boundaries within which the current analysis remains accurate.
Summary
The Swiss Market Index is in a corrective phase, with Gray Wave 2 in progress after the completion of Gray Wave 1. The next anticipated move is Gray Wave 3, which will mark a continuation of the trend. The wave cancel invalidation level at 11,419.25 is critical for maintaining the validity of the current Elliott Wave count.
Swiss Market Index Elliott Wave technical analysis
-
Function: Bullish Trend.
-
Mode: Impulsive.
-
Structure: Orange Wave 3.
-
Position: Navy Blue Wave 3.
-
Direction next higher degrees: Orange Wave 3 (started).
-
Details: Orange Wave 2 completed, now Orange Wave 3 is in play.
-
Wave cancel invalid level: 11,419.25.
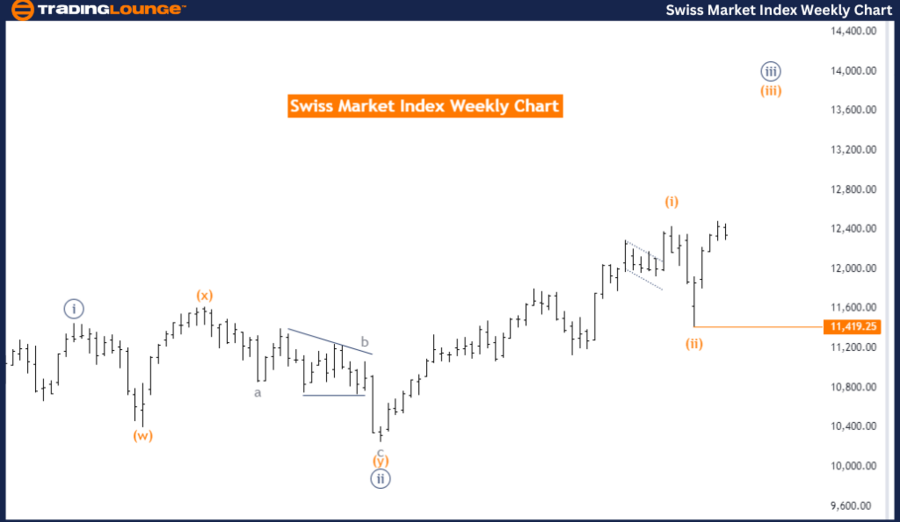
According to Elliott Wave analysis on the Weekly Chart, the Swiss Market Index is currently in a bullish trend. The market mode is impulsive, indicating strong, directional price movements. The structure of the market is identified as Orange Wave 3, which is part of a larger upward movement.
Currently, the market is within Navy Blue Wave 3, a component of the broader Orange Wave 3. This suggests that the market is in the midst of a significant impulsive wave, typically characterized by strong price movements that align with the overall trend.
The direction for the next higher degrees remains Orange Wave 3, which has already begun. This wave is expected to push the market further upward, continuing the bullish trend. The completion of Orange Wave 2 has paved the way for Orange Wave 3 to unfold, signaling potential further gains in the near future.
A crucial aspect of this analysis is the wave cancellation invalidation level, set at 11,419.25. If the market reaches or surpasses this level, the current Elliott Wave count would be invalidated, meaning the expected wave structure would no longer apply. This invalidation level serves as an important reference point for traders and analysts to monitor the ongoing validity of the wave count.
Summary
The Swiss Market Index is in a strong bullish trend, with Orange Wave 3 currently in progress following the completion of Orange Wave 2. The market is positioned within Navy Blue Wave 3, and the continuation of the upward trend is anticipated. The wave cancellation invalidation level is 11,419.25, which is key for maintaining the accuracy of the current Elliott Wave analysis.
Swiss Market Index Elliott Wave technical analysis [Video]
Author

Peter Mathers
TradingLounge
Peter Mathers started actively trading in 1982. He began his career at Hoei and Shoin, a Japanese futures trading company.


