Swiss Market Index Elliott Wave technical analysis [Video]
![Swiss Market Index Elliott Wave technical analysis [Video]](https://editorial.fxstreet.com/images/TechnicalAnalysis/ChartPatterns/Chartism/stock-market-ticker-board-black-17803444_XtraLarge.jpg)
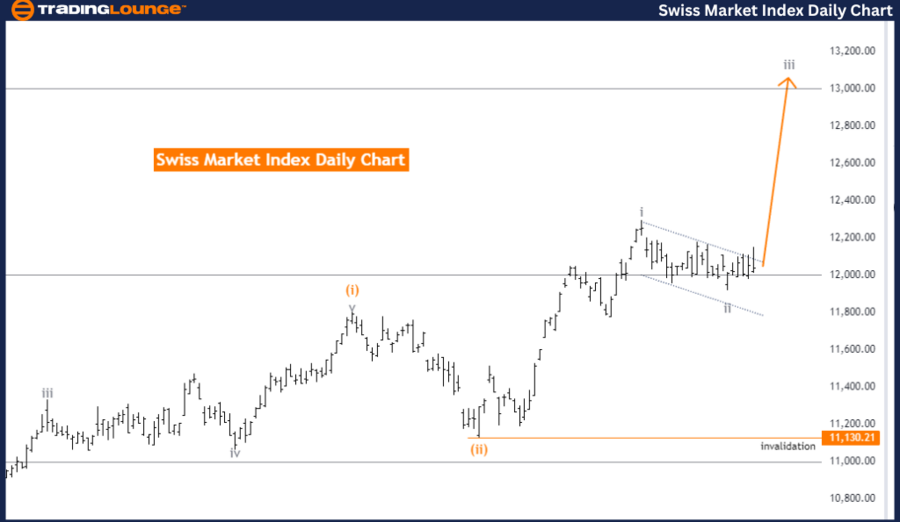
Swiss Market Index Elliott Wave analysis - Daily chart
Trend analysis and wave structure
Function: Trend
Mode: Impulsive
Structure: Gray Wave 3
Position: Orange Wave 3
Direction next higher degrees: Gray Wave 3 (started)
Details: Gray Wave 2 of Orange Wave 3 completed, now Gray Wave 3 in play
Wave cancel invalid level: 11130.21
The Swiss Market Index (SMI) Elliott Wave Analysis on the daily chart provides a comprehensive view of the current market trends and wave structures. The primary function of this analysis is to identify the prevailing trend, classified as impulsive, indicating strong market movement and significant price changes.
The focus is on Gray Wave 3, suggesting an active market phase. The current position within this structure is Orange Wave 3, a subset of Gray Wave 3. This indicates a robust upward trend with strong momentum pushing prices higher.
Current wave structure
The next higher degree continues with Gray Wave 3, which has already started. This continuation suggests the market is expected to maintain its upward trajectory within this impulsive wave structure.
Key details include the completion of Gray Wave 2 of Orange Wave 3, marking the end of a corrective phase and the start of the current impulsive movement within Gray Wave 3. The wave cancel invalid level is set at 11130.21, meaning if the market index falls below this level, the current wave analysis would be invalidated.
Summary
-
Trend: Impulsive.
-
Current Wave: Gray Wave 3.
-
Position: Orange Wave 3 within Gray Wave 3.
-
Momentum: Strong upward movement.
-
Wave Cancel Invalid Level: 11130.21.
This analysis helps traders and analysts anticipate market behavior and make informed decisions, expecting continued robust upward movement within the current wave structure. The wave cancel invalid level at 11130.21 is crucial for validating the ongoing wave analysis.
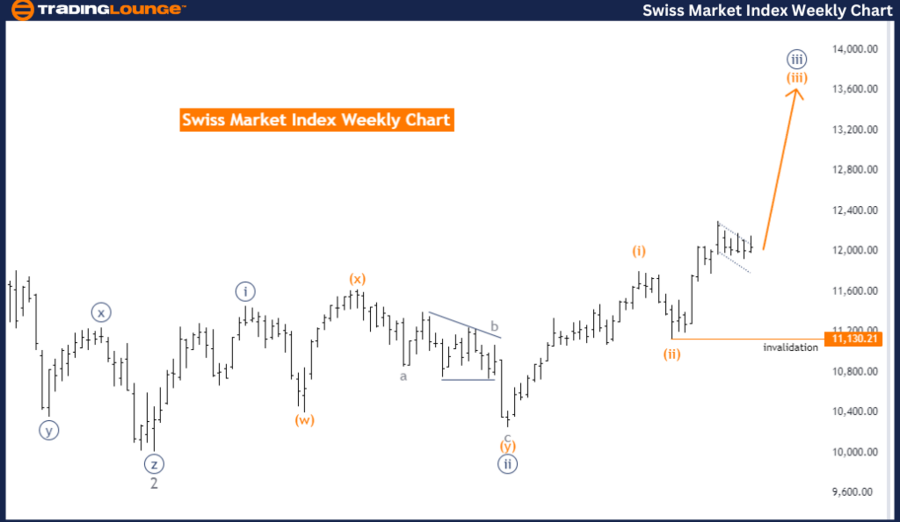
Swiss Market Index Elliott Wave analysis - Weekly chart
Trend analysis and wave structure
Function: Trend.
Mode: Impulsive.
Structure: Orange Wave 3.
Position: Navy Blue Wave 3.
Direction next lower degrees: Orange Wave 4.
Details: Orange Wave 2 of Wave 3 completed, now Orange Wave 3 in play.
Wave cancel Invalid level: 11130.21.
The Swiss Market Index (SMI) Elliott Wave Analysis on the weekly chart offers a detailed view of current market trends and wave structures. The primary function of this analysis is to identify the trend, classified as impulsive, indicating strong market movement and significant price changes.
The focus is on Orange Wave 3, indicating substantial market activity. The current position within this structure is Navy Blue Wave 3, part of the larger Orange Wave 3. This positioning suggests the market is in the midst of an aggressive upward trend within the broader impulsive wave.
Current wave structure
The direction for the next lower degrees is Orange Wave 4, implying that after the current wave's completion, the market will transition into the subsequent phase of the wave cycle. This next phase is expected to follow the established upward momentum, albeit with some corrective movements typical of Wave 4 phases.
Key details include the completion of Orange Wave 2 of Wave 3, marking the end of a corrective phase before the current impulsive movement. Presently, Orange Wave 3 is in play, reflecting a significant upward trajectory. The wave cancel invalid level is set at 11130.21, meaning if the market index falls below this level, the current wave analysis would be invalidated.
Summary
-
Trend: Impulsive.
-
Current Wave: Orange Wave 3.
-
Position: Navy Blue Wave 3 within Orange Wave 3.
-
Momentum: Strong upward movement.
-
Wave Cancel Invalid Level: 11130.21.
This analysis assists traders and analysts in predicting market behavior and making informed decisions, anticipating continued robust upward movement within the current wave structure. The wave cancellation invalid level at 11130.21 is critical for validating the ongoing wave analysis.
Swiss Market Index Elliott Wave technical analysis [Video]
Author

Peter Mathers
TradingLounge
Peter Mathers started actively trading in 1982. He began his career at Hoei and Shoin, a Japanese futures trading company.


