Swiss Market Index Elliott Wave technical analysis [Video]
![Swiss Market Index Elliott Wave technical analysis [Video]](https://editorial.fxstreet.com/images/Macroeconomics/Countries/Europe/Switzerland/swiss-flag-20552432_XtraLarge.jpg)
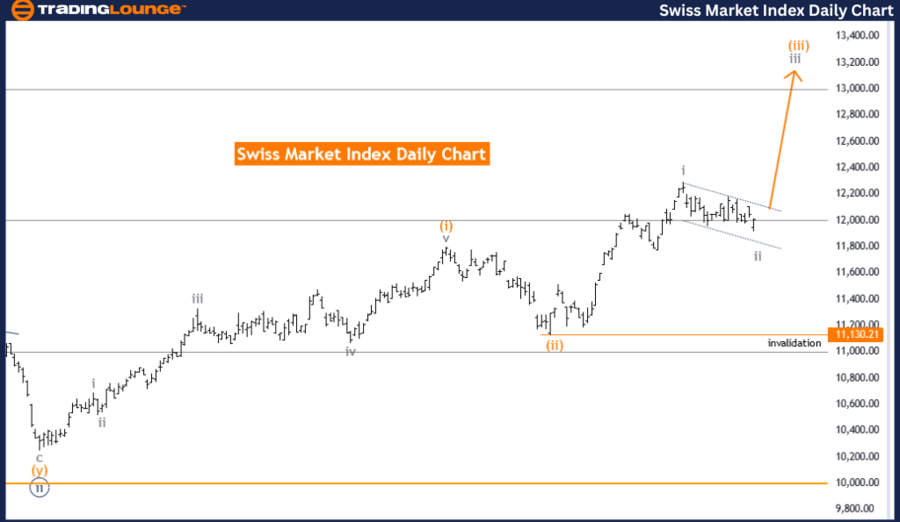
Swiss Market Index Elliott Wave Analysis (Daily Chart).
Swiss Market Index Elliott Wave technical analysis
Function: Trend.
Mode: Corrective.
Structure: Gray wave 2.
Position: Orange wave 3.
Direction next higher degrees: Gray wave 3.
Details: Gray wave 2 of orange wave 3 is in play and looking near to end. Wave cancel invalid level: 11130.21.
The Swiss Market Index (SMI) is currently analyzed through Elliott Wave Theory on the daily chart. This analysis identifies the function as a trend, indicating the market's expected continuation in an overall direction. The trend mode is corrective, suggesting a temporary reversal or consolidation phase rather than a strong impulsive move.
The structure under analysis is gray wave 2, part of a larger orange wave 3. In Elliott Wave terminology, wave 2 typically represents a corrective phase that retraces some gains or losses made in wave 1. The market's current position within this orange wave 3 indicates that after gray wave 2 completes, the market is expected to resume its primary trend in wave 3.
The direction for the next higher degrees is gray wave 3, suggesting that once gray wave 2 completes, the market will move into gray wave 3. This wave is usually strong and impulsive, indicating a significant move in the primary trend's direction.
Details of the analysis show that gray wave 2 of orange wave 3 is currently in play and nearing its end. This implies that the corrective phase of gray wave 2 is almost complete, and the market is preparing to transition into gray wave 3 of orange wave 3. This transition is expected to result in a strong movement in the primary trend's direction.
The wave cancel invalid level is set at 11130.21. This level serves as a critical threshold; if the market moves beyond this point, the current wave count would be invalidated, necessitating a reassessment of the wave structure.
Summary
The Swiss Market Index on the daily chart is in a corrective phase within gray wave 2 of orange wave 3, which is nearing completion. The market is expected to transition into gray wave 3, indicating a strong movement in the primary trend's direction. The wave cancel invalid level is 11130.21, beyond which the current analysis would need to be reconsidered.
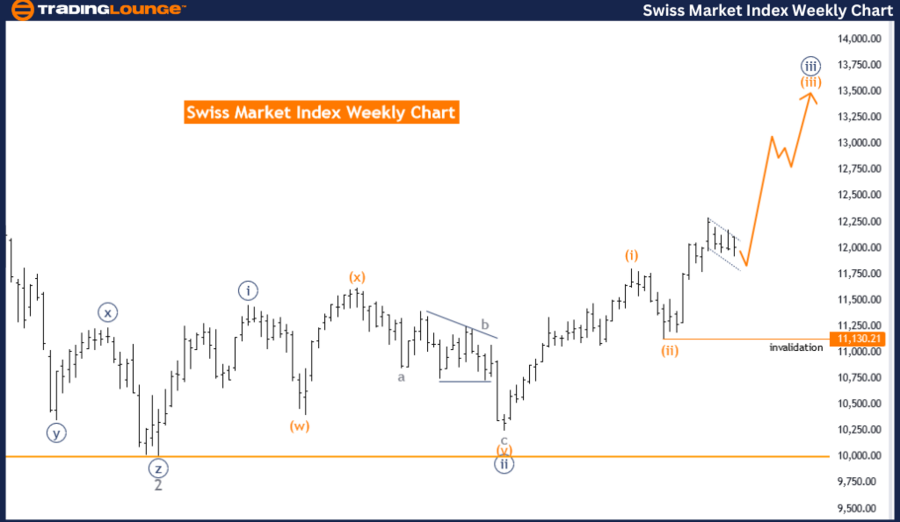
Swiss Market Index Elliott Wave analysis – weekly chart
Function: Trend.
Mode: Impulsive.
Structure: Orange wave 3.
Position: Navy blue wave 3.
Direction next higher degrees: Navy blue wave 3 (continue).
Details: Orange wave 2 looking completed, now orange wave 3 is in play. Wave cancel invalid level: 11130.21.
The Swiss Market Index (SMI) is analyzed using Elliott Wave Theory on the weekly chart. This analysis identifies the function as a trend, indicating the market is expected to follow a general upward or downward trajectory. The trend mode is impulsive, signifying a strong, directional movement in the market.
The structure under consideration is orange wave 3, suggesting a significant and powerful movement as part of the overall wave sequence. Currently, the market is positioned in navy blue wave 3, a critical phase indicating continued momentum in the primary trend direction.
The direction for the next higher degrees remains navy blue wave 3, suggesting that the market will maintain its strong, impulsive movement as it progresses further within navy blue wave 3.
Details of the analysis reveal that orange wave 2 is now considered complete. With orange wave 2 concluded, orange wave 3 is currently in play. This transition marks a shift from a corrective phase to a strong, impulsive phase, indicating a robust continuation of the market trend.
The wave cancel invalid level is identified at 11130.21. This level acts as a critical threshold; if the market surpasses this point, the current wave count would be invalidated, necessitating a re-evaluation of the wave structure.
Summary
The Swiss Market Index on the weekly chart is in a strong, impulsive trend within orange wave 3, currently positioned in navy blue wave 3. With orange wave 2 completed, the market is now in the midst of orange wave 3, indicating a powerful continuation of the primary trend. The wave cancel invalid level is set at 11130.21, beyond which the current analysis would need to be reconsidered.
Swiss Market Index Elliott Wave technical analysis [Video]
Author

Peter Mathers
TradingLounge
Peter Mathers started actively trading in 1982. He began his career at Hoei and Shoin, a Japanese futures trading company.


