Swiss Market Index Elliott Wave technical analysis [Video]
![Swiss Market Index Elliott Wave technical analysis [Video]](https://editorial.fxstreet.com/images/Markets/Currencies/Majors/USDCHF/swiss-currency-17616077_XtraLarge.jpg)
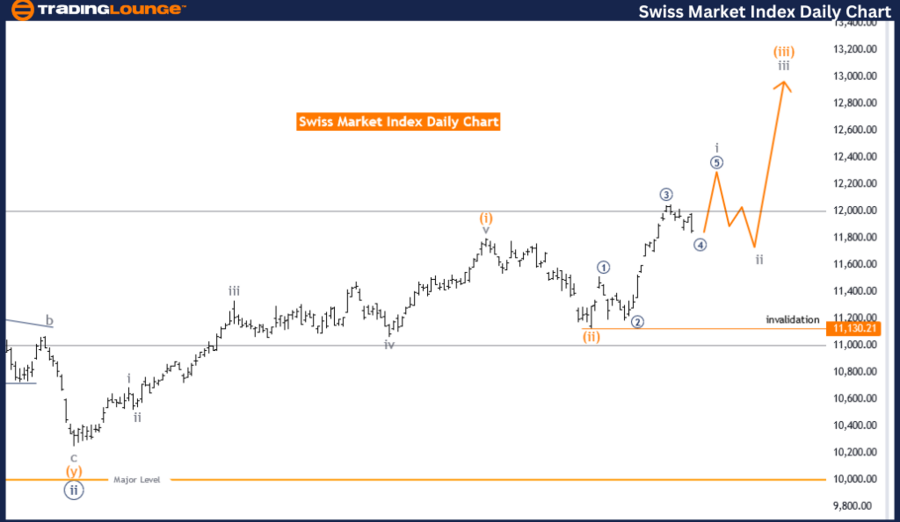
Swiss Market Index Elliott Wave Analysis Trading Lounge Day Chart.
Swiss Market Index Elliott Wave technical analysis
Function: Trend.
Mode: Impulsive.
Structure: Gray wave 1.
Position: Orange wave 3.
Direction next lower degrees: Gray wave 2.
Details: Gray wave 1 of orange wave 3 is in play.
Wave cancel invalid level: 11130.21.
The Swiss Market Index Elliott Wave Analysis on the day chart offers insights into the market's trend using the Elliott Wave Principle. The analysis categorizes the current function as a trend, indicating that the price movements are aligned with the prevailing market direction. The mode is impulsive, suggesting that the market is in a strong, directional phase rather than experiencing a corrective or sideways movement.
The wave structure currently under observation is gray wave 1, which is part of a larger sequence identified as orange wave 3. This implies that the market is in the early stages of a significant upward movement, with gray wave 1 representing the initial phase of this advance.
The position of the market within these waves is critical for understanding its future direction. Currently, gray wave 1 of orange wave 3 is actively developing. This stage is essential as it sets the foundation for subsequent waves, indicating the market's potential for continued upward momentum. The direction for the next lower degrees, which will follow, is gray wave 2. This suggests that after the completion of gray wave 1, a corrective phase will ensue before the market resumes its upward trend in orange wave 3.
An important detail in this analysis is the invalidation level set at 11130.21. This level is crucial for traders and analysts as it acts as a threshold for the validity of the current wave count. If the market price drops to or below this level, the existing Elliott Wave structure would be invalidated, necessitating a reassessment of the wave patterns and potential adjustments in trading strategies.
In summary, the Swiss Market Index Elliott Wave Analysis on the day chart indicates that the market is in a strong upward trend, with gray wave 1 of orange wave 3 currently in play. This impulsive mode suggests continued upward momentum, with gray wave 2 expected to follow as a corrective phase. The invalidation level at 11130.21 is a critical benchmark for maintaining the validity of this wave count, ensuring that market strategies can be adjusted if necessary. This analysis helps traders anticipate market movements and refine their strategies based on the Elliott Wave patterns.
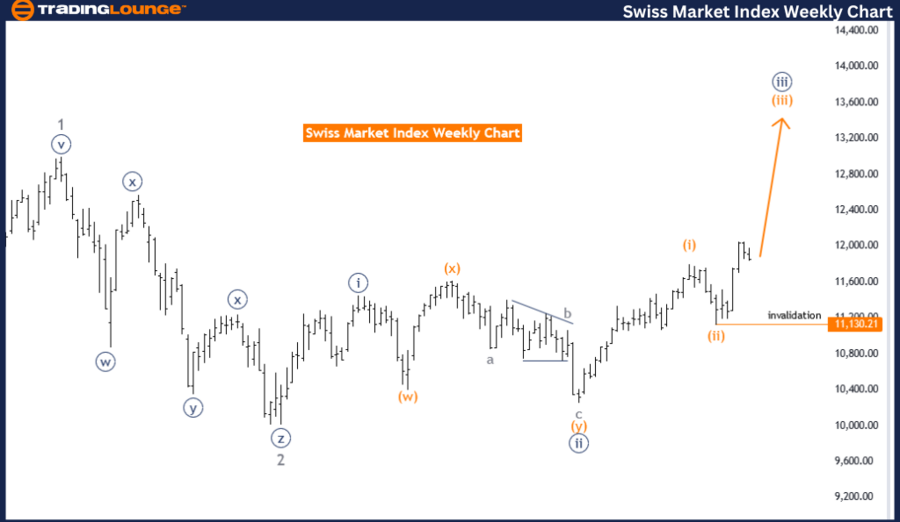
Swiss Market Index Elliott Wave analysis weekly chart
Function: Trend.
Mode: Impulsive.
Structure: Orange wave 3.
Position: Navy blue wave 3.
Direction next lower degrees: Orange wave 4.
Details: Orange wave 2 of 3 looking completed at 11130.21. Now orange wave 3 is in play.
Wave cancel invalid level: 11130.21
The Swiss Market Index Elliott Wave Analysis on the weekly chart provides an in-depth look into the market's directional trends using the Elliott Wave Theory. This analysis identifies the function as a trend, indicating that the market is moving in a consistent, identifiable direction. The mode is classified as impulsive, which suggests strong and definitive price movements rather than a corrective or sideways trend.
The primary wave structure currently being analyzed is orange wave 3, which is part of a larger sequence identified as navy blue wave 3. This classification is significant as it highlights that the market is in the midst of a major upward movement. Within this context, the position of the market is situated in navy blue wave 3, which further confirms the ongoing strength of the upward trend.
The direction for the next lower degrees will be orange wave 4. This indicates that after the completion of the current orange wave 3, a corrective phase is expected to follow before the market resumes its upward trajectory. This pattern helps traders anticipate a temporary pullback before the continuation of the broader uptrend.
A key detail in this analysis is the completion of orange wave 2 of 3 at the level of 11130.21. This completion marks the end of a corrective phase and the commencement of the impulsive orange wave 3, which is currently in play. The invalidation level is also set at 11130.21, which serves as a crucial threshold. If the market price falls to or below this level, the current wave count would be invalidated, necessitating a reevaluation of the wave structure and potentially altering trading strategies.
In summary, the Swiss Market Index Elliott Wave Analysis on the weekly chart suggests a strong upward trend within the impulsive mode of orange wave 3. The market is currently in navy blue wave 3, with the next anticipated phase being orange wave 4. The completion of orange wave 2 at 11130.21 indicates that orange wave 3 is now in progress. The invalidation level at 11130.21 is critical for maintaining the integrity of this wave count. This analysis aids traders in understanding market movements and refining their strategies based on the Elliott Wave patterns, anticipating both the continuation of the trend and potential corrective phases.
Swiss Market Index Elliott Wave technical analysis [Video]
Author

Peter Mathers
TradingLounge
Peter Mathers started actively trading in 1982. He began his career at Hoei and Shoin, a Japanese futures trading company.


