SuperMicro Computers Inc. (SMCI) Elliott Wave technical analysis [Video]
![SuperMicro Computers Inc. (SMCI) Elliott Wave technical analysis [Video]](https://editorial.fxstreet.com/images/Markets/Equities/Industries/Pharma/laboratory-material-637435382896308676_XtraLarge.jpg)
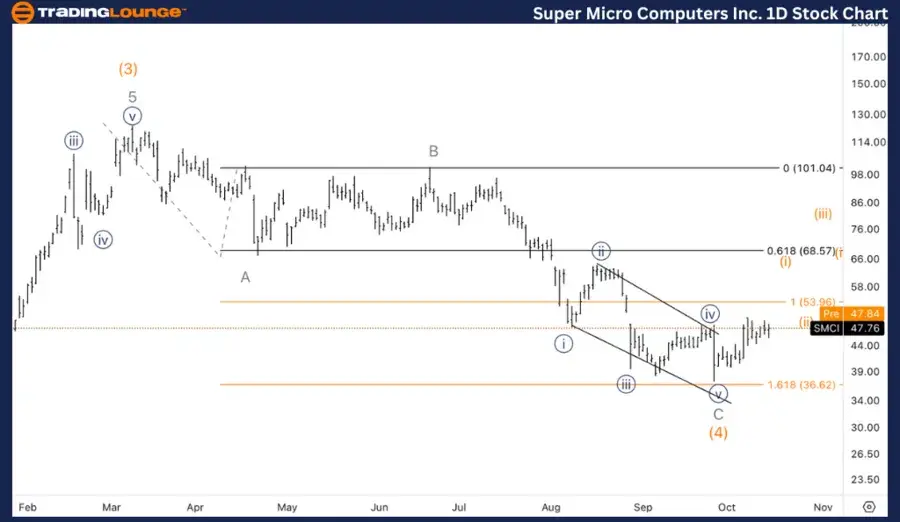
SMCI Elliott Wave Analysis Trading Lounge Daily Chart,
SuperMicro Computers Inc., (SMCI) Daily Chart.
SMCI Elliott Wave technical analysis
Function: Counter Trend.
Mode: Corrective.
Structure: Flat.
Position: Intermediate (4).
Direction: Bottom in wave (4).
Details: We are exploring the possibility of a bottom in wave (4) which ended with an ending diagonal in wave C of (4).
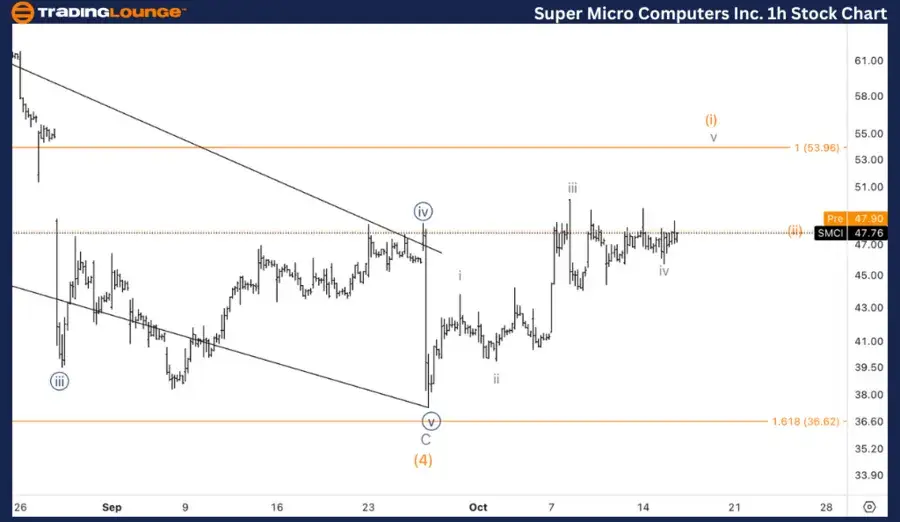
SuperMicro Computers Inc., (SMCI) 1H Chart
SMCI Elliott Wave technical analysis
Function: Trend.
Mode: Impulsive.
Structure: Motive.
Position: Wave (i) of {i}.
Direction: Upside in wave (i).
Detaisl: Here we are looking at what appears to be a nice five wave subdivision within wave (i) where we currently seem to be in the final stages of a triangle in wave iv.
This analysis focuses on the current trend structure of SuperMicro Computers Inc., (SMCI) utilizing the Elliott Wave Theory on both the daily and 1-hour charts. Below is a breakdown of the stock's position and potential future movements.
SMCI Elliott Wave technical analysis – Daily chart
On the daily chart, SMCI appears to have completed a corrective Intermediate wave (4), which ended with an ending diagonal in wave C of (4). This suggests that the correction phase is likely nearing completion, and we may now see the beginning of a bullish move as wave (5) starts to unfold.
SMCI Elliott Wave technical analysis – One-hour chart
On the 1-hour chart, SMCI is progressing through wave (i) of {i}, and we can observe a well-structured five-wave subdivision within this initial impulsive wave. Currently, the stock is in the final stages of a triangle formation in wave iv, suggesting that the next move could be the breakout to complete wave (v) of (i), pushing prices higher.
Technical analyst: Alessio Barretta.
SMCI Elliott Wave technical analysis [Video]
Author

Peter Mathers
TradingLounge
Peter Mathers started actively trading in 1982. He began his career at Hoei and Shoin, a Japanese futures trading company.


