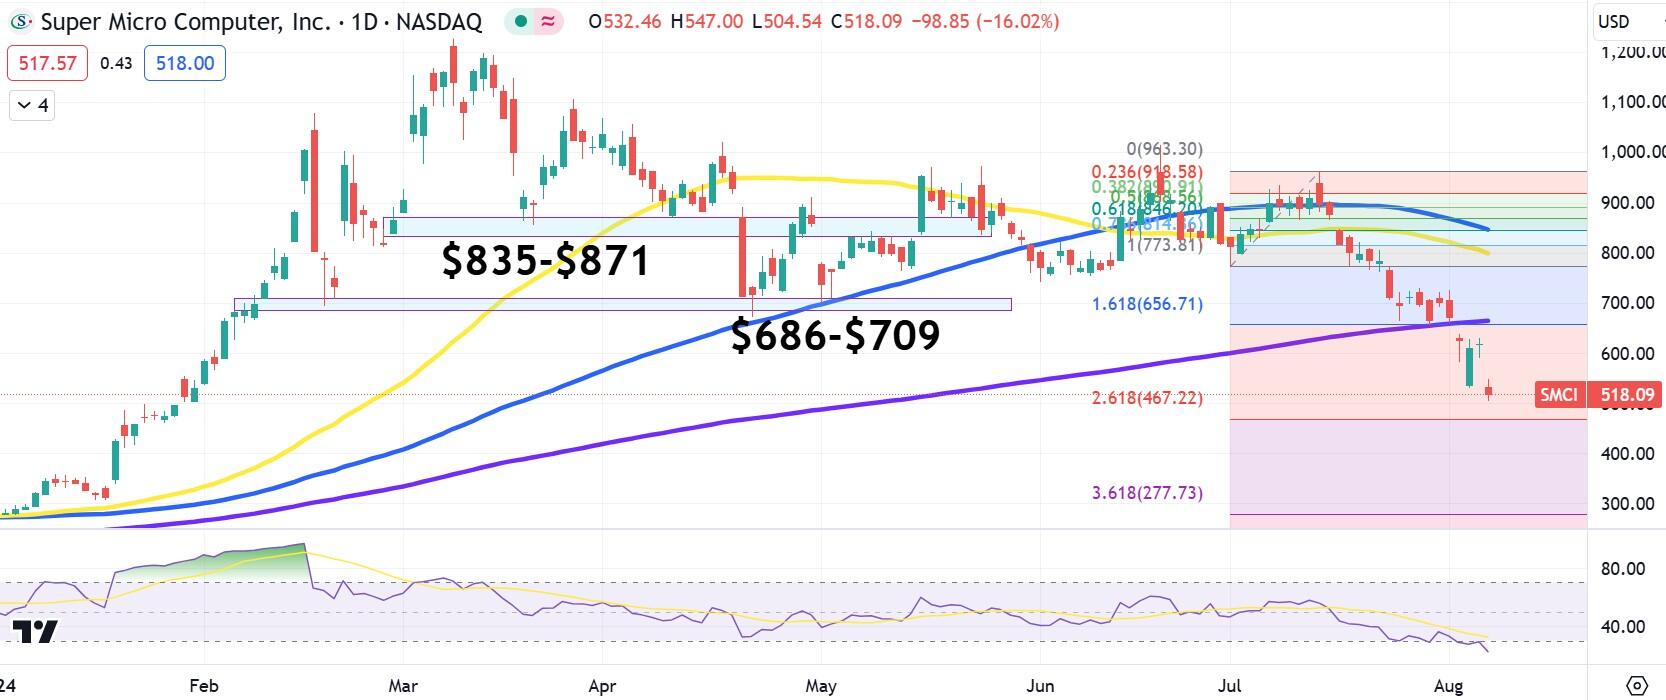
- SMCI experiences its worst plunge since April 19.
- Operating margins slim down in recent quarter, shortages hurt profits.
- Management is guiding for between $26B and $30B in FY 2025 revenue.
- Super Micro stock is trading 58% off its March 8 high.
Super Micro Computer (SMCI), the best-performing S&P 500 stock in the first half of the year, has tumbled some 16% on Wednesday following a worse than expected fiscal fourth-quarter result. The designer of state-of-the-art server software, server hardware and cooling solutions has seen its fortunes explode higher in recent years on the back of the Nvidia-led (NVDA) artificial intelligence (AI) revolution.
But late Tuesday, Super Micro posted adjusted earnings per share (EPS) of $6.25, $1.89 below Wall Street consensus as well as the previous quarter’s $6.65. Revenue of $5.31 billion, however, was largely in-line with projections and rose 144% from a year earlier.
The Street at large continues to recover from its bashing last Friday and again on Monday, which saw massive selling across industries and markets. Both the S&P 500 and NASDAQ Composite have added more than 1% at the time of writing.
Super Micro Computer earnings news
Super Micro’s CEO, Charles Liang, blamed the earnings miss on a shortage of components and lighter operating margins.
“Our Q4 operating margin is 7.8%, which is lower than what we expected due to the higher mix of hyperscale datacenter business and expedited costs of our DLC liquid cooling components in June and September quarters,” Liang said during the earnings call. “Some key new components’ shortage delayed about $800 million of revenue shipments to July, which lowered our EPS for June and will be recognized in our September quarter.”
Management said that net revenue would arrive between $6 billion and $7 billion during the present quarter, which ends in September. That range was well above the consensus choice of $5.45 billion, so it seems like the company’s prospects are not slowing down.
More shockingly, Liang and company gave guidance for full fiscal-year 2025 of between $26 billion and $30 billion. Fiscal 2024 saw total sales of just under $15 billion. In other words, management expects sales to nearly double within 12 months.
Adjusted EPS next quarter also looks quite healthy in the $6.69 to $8.27 range. Management also said they would undertake a 10-for-1 stock split in October.
AI stocks FAQs
First and foremost, artificial intelligence is an academic discipline that seeks to recreate the cognitive functions, logical understanding, perceptions and pattern recognition of humans in machines. Often abbreviated as AI, artificial intelligence has a number of sub-fields including artificial neural networks, machine learning or predictive analytics, symbolic reasoning, deep learning, natural language processing, speech recognition, image recognition and expert systems. The end goal of the entire field is the creation of artificial general intelligence or AGI. This means producing a machine that can solve arbitrary problems that it has not been trained to solve.
There are a number of different use cases for artificial intelligence. The most well-known of them are generative AI platforms that use training on large language models (LLMs) to answer text-based queries. These include ChatGPT and Google’s Bard platform. Midjourney is a program that generates original images based on user-created text. Other forms of AI utilize probabilistic techniques to determine a quality or perception of an entity, like Upstart’s lending platform, which uses an AI-enhanced credit rating system to determine credit worthiness of applicants by scouring the internet for data related to their career, wealth profile and relationships. Other types of AI use large databases from scientific studies to generate new ideas for possible pharmaceuticals to be tested in laboratories. YouTube, Spotify, Facebook and other content aggregators use AI applications to suggest personalized content to users by collecting and organizing data on their viewing habits.
Nvidia (NVDA) is a semiconductor company that builds both the AI-focused computer chips and some of the platforms that AI engineers use to build their applications. Many proponents view Nvidia as the pick-and-shovel play for the AI revolution since it builds the tools needed to carry out further applications of artificial intelligence. Palantir Technologies (PLTR) is a “big data” analytics company. It has large contracts with the US intelligence community, which uses its Gotham platform to sift through data and determine intelligence leads and inform on pattern recognition. Its Foundry product is used by major corporations to track employee and customer data for use in predictive analytics and discovering anomalies. Microsoft (MSFT) has a large stake in ChatGPT creator OpenAI, the latter of which has not gone public. Microsoft has integrated OpenAI’s technology with its Bing search engine.
Following the introduction of ChatGPT to the general public in late 2022, many stocks associated with AI began to rally. Nvidia for instance advanced well over 200% in the six months following the release. Immediately, pundits on Wall Street began to wonder whether the market was being consumed by another tech bubble. Famous investor Stanley Druckenmiller, who has held major investments in both Palantir and Nvidia, said that bubbles never last just six months. He said that if the excitement over AI did become a bubble, then the extreme valuations would last at least two and a half years or long like the DotCom bubble in the late 1990s. At the midpoint of 2023, the best guess is that the market is not in a bubble, at least for now. Yes, Nvidia traded at 27 times forward sales at that time, but analysts were predicting extremely high revenue growth for years to come. At the height of the DotCom bubble, the NASDAQ 100 traded for 60 times earnings, but in mid-2023 the index traded at 25 times earnings.
Super Micro Computer stock forecast
SMCI shares were already trending below their 200-day Simple Moving Average (SMA), so shareholders can't say they weren't warned. If there is any hope for serious support, it may be the $467.22 level formed by the 261.8% Fibonacci Retracement. When SMCI rallied hard in late January that it where it discovered brief consolidation before exploding higher.
The 200-day SMA near $700 and the 161.8% Fibo at $656 make that the region to overcome in order to put an end to the downtrend. Wednesday's plunge was the worst performance since April 19's 23% slide, but the massive revenue guidance should help the share price heading into November earnings, so now may be a great time for entry.
SMCI daily chart
Information on these pages contains forward-looking statements that involve risks and uncertainties. Markets and instruments profiled on this page are for informational purposes only and should not in any way come across as a recommendation to buy or sell in these assets. You should do your own thorough research before making any investment decisions. FXStreet does not in any way guarantee that this information is free from mistakes, errors, or material misstatements. It also does not guarantee that this information is of a timely nature. Investing in Open Markets involves a great deal of risk, including the loss of all or a portion of your investment, as well as emotional distress. All risks, losses and costs associated with investing, including total loss of principal, are your responsibility. The views and opinions expressed in this article are those of the authors and do not necessarily reflect the official policy or position of FXStreet nor its advertisers. The author will not be held responsible for information that is found at the end of links posted on this page.
If not otherwise explicitly mentioned in the body of the article, at the time of writing, the author has no position in any stock mentioned in this article and no business relationship with any company mentioned. The author has not received compensation for writing this article, other than from FXStreet.
FXStreet and the author do not provide personalized recommendations. The author makes no representations as to the accuracy, completeness, or suitability of this information. FXStreet and the author will not be liable for any errors, omissions or any losses, injuries or damages arising from this information and its display or use. Errors and omissions excepted.
The author and FXStreet are not registered investment advisors and nothing in this article is intended to be investment advice.
Recommended content
Editors’ Picks

EUR/USD extends recovery beyond 1.0400 amid Wall Street's turnaround
EUR/USD extends its recovery beyond 1.0400, helped by the better performance of Wall Street and softer-than-anticipated United States PCE inflation. Profit-taking ahead of the winter holidays also takes its toll.

GBP/USD nears 1.2600 on renewed USD weakness
GBP/USD extends its rebound from multi-month lows and approaches 1.2600. The US Dollar stays on the back foot after softer-than-expected PCE inflation data, helping the pair edge higher. Nevertheless, GBP/USD remains on track to end the week in negative territory.

Gold rises above $2,620 as US yields edge lower
Gold extends its daily rebound and trades above $2,620 on Friday. The benchmark 10-year US Treasury bond yield declines toward 4.5% following the PCE inflation data for November, helping XAU/USD stretch higher in the American session.

Bitcoin crashes to $96,000, altcoins bleed: Top trades for sidelined buyers
Bitcoin (BTC) slipped under the $100,000 milestone and touched the $96,000 level briefly on Friday, a sharp decline that has also hit hard prices of other altcoins and particularly meme coins.

Bank of England stays on hold, but a dovish front is building
Bank of England rates were maintained at 4.75% today, in line with expectations. However, the 6-3 vote split sent a moderately dovish signal to markets, prompting some dovish repricing and a weaker pound. We remain more dovish than market pricing for 2025.

Best Forex Brokers with Low Spreads
VERIFIED Low spreads are crucial for reducing trading costs. Explore top Forex brokers offering competitive spreads and high leverage. Compare options for EUR/USD, GBP/USD, USD/JPY, and Gold.
