Sun Pharmaceuticals Elliott Wave technical analysis [Video]
![Sun Pharmaceuticals Elliott Wave technical analysis [Video]](https://editorial.fxstreet.com/images/Markets/Equities/Industries/Pharma/vaccine-development_XtraLarge.jpg)
SUNPHARMA Elliott Wave technical analysis
Function: Larger Degree Trend Higher (Intermediate Degree orange).
Mode: Motive.
Structure: Impulse.
Position: Minute Wave ((v)) Navy.
Details: Minute Wave ((v)) of Minor Wave 3 Grey might be complete around 1950-75 range. Please note that 2000 mark is major resistance. Alternatively Minor Waves 3, 4 and 5 could be complete as marked, and a larger degree corrective wave could resume soon.
Invalidation point: 1830 risk tightened.
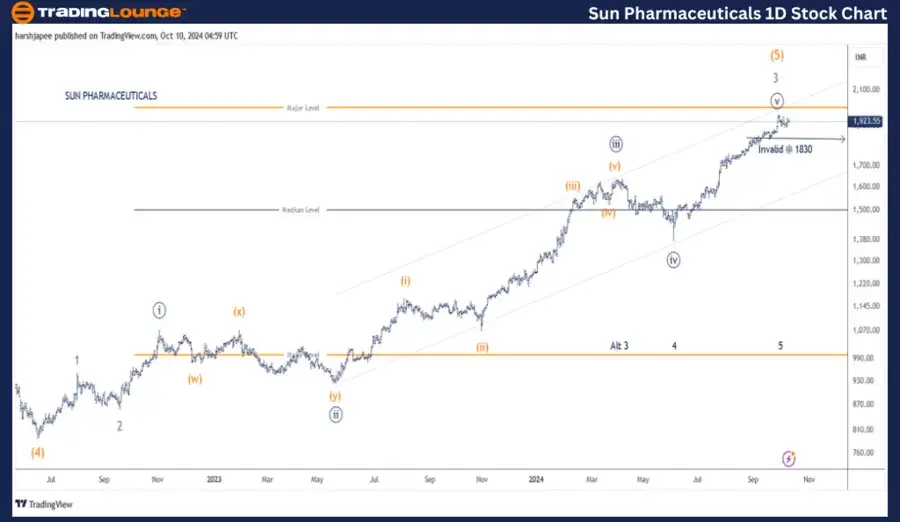
Sun Pharmaceuticals daily chart technical analysis and potential Elliott Wave counts
Sun Pharmaceuticals daily chart is suggesting Minor Wave 3 Grey might be complete around 1975-80 zone or near to completion. If correct, expect a turn lower to unfold Minor Wave 4 towards 1380 at least. Alternatively, Minor Waves 3, 4 and 5 are now complete and the stock is ready for a much deeper correction.
The stock bottomed around 790 low in June 2022, terminating Intermediate Wave (4) Orange. The rally since then has potentially sub divided into 3 waves with Minor Wave 3 and Minute Wave ((iii)) extended. Minute Wave ((iv)) of 3 terminated around 1380 on June 0, 2024.
Minute Wave ((v)) of 3 has been unfolding against 1380 mark and looks complete just below the 2000 mark. If the above proposed wave counts hold well, we should witness a corrective drop as Minor Wave 4 begins to unfold. We will highlight the alternate count with respect to price action going forward.
SUNPHARMA Elliott Wave technical analysis
Function: Larger Degree Trend Higher (Intermediate Degree orange).
Mode: Motive.
Structure: Impulse.
Position: Minute Wave ((v)) Navy.
Details: Minute Wave ((v)) of Minor Wave 3 Grey might be complete around 1950-75 range. Please note that 2000 mark is major resistance. Alternatively Minor Waves 3, 4 and 5 could be complete as marked on the daily chart, and a larger degree corrective wave could resume soon.
Invalidation point: 1830 risk tightened.
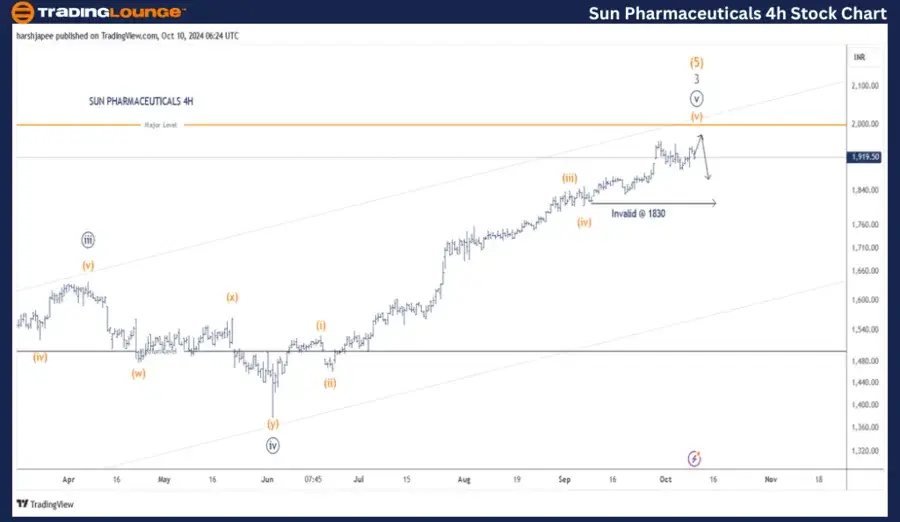
Sun Pharmaceuticals four-hour chart technical analysis and potential Elliott Wave counts
Sun Pharmaceuticals 4H chart primarily highlights the sub waves since Minute Wave ((iv)) of Minor Wave 3 terminated around 1380 mark. High probability remains that Minor Wave 3 Grey is complete around 1975-80 as bears prepare to drag lower soon.
Conclusion
Sun Pharmaceuticals has potentially terminated Minor Wave 3 Grey with Intermediate Wave (5) Orange around 1975-80. Watch out for a corrective drop as Minor Wave 4 should be underway soon.
SUNPHARMA Elliott Wave technical analysis [Video]
Author

Peter Mathers
TradingLounge
Peter Mathers started actively trading in 1982. He began his career at Hoei and Shoin, a Japanese futures trading company.


