Stocks: Uncertainty amid tariff tensions, data, and earnings

Will stocks continue their short-term uptrend after last week's rally?
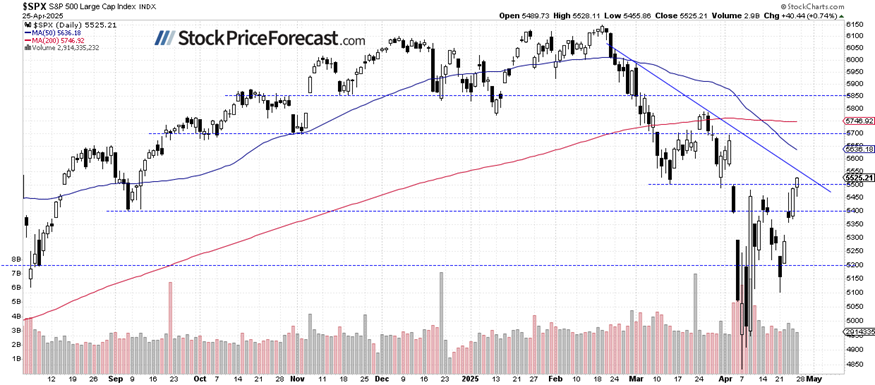
The S&P 500 gained 0.74% on Friday, reaching its highest level since early April and testing the daily gap down from April 3. The market is advancing on easing tariff fears, potential peace in Ukraine, and quarterly earnings releases. Today, however, S&P 500 futures suggest a 0.2% lower open, likely consolidating following last week's impressive rally.
Investor sentiment has worsened, as shown in last Wednesday’s AAII Investor Sentiment Survey, which reported that only 21.9% of individual investors are bullish, while 55.6% are bearish.
The S&P 500 broke above 5,500 level, as we can see on the daily chart.
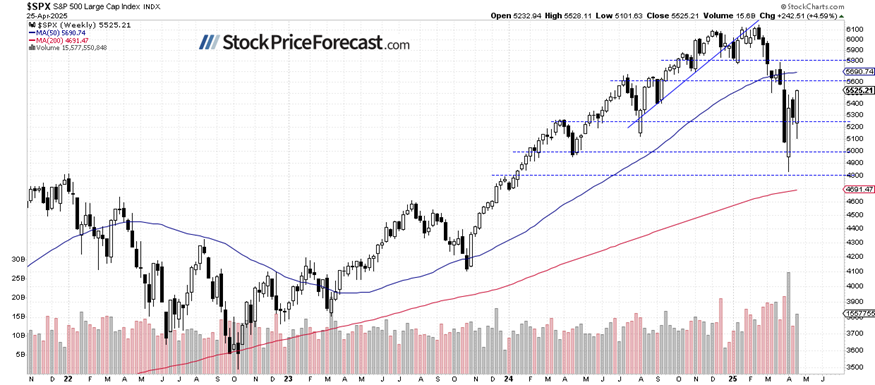
S&P 500: Almost 5% higher in a week
Last week, the S&P 500 gained 4.59%, retracing more of its early April sell-off. Despite this strong performance, it remains uncertain whether we're seeing a new uptrend forming or just a correction within the broader downtrend.
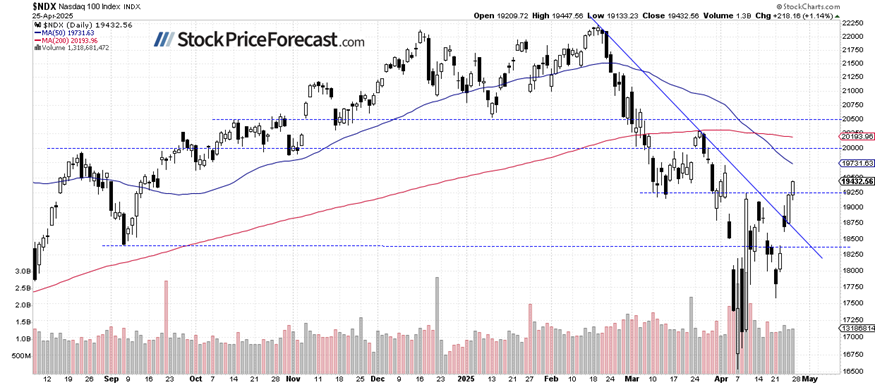
Nasdaq 100 extends its rally
The Nasdaq 100 1.14% higher on Friday, extending its advance after breaking above the 19,000 level on Thursday. Positive sentiment was supported by better-than-expected quarterly results from Alphabet (GOOG) which stoked fresh optimism on artificial intelligence.
Potential resistance for the Nasdaq 100 is around 19,700, marked by the previous local high, while a support is at 19,000-19,200.
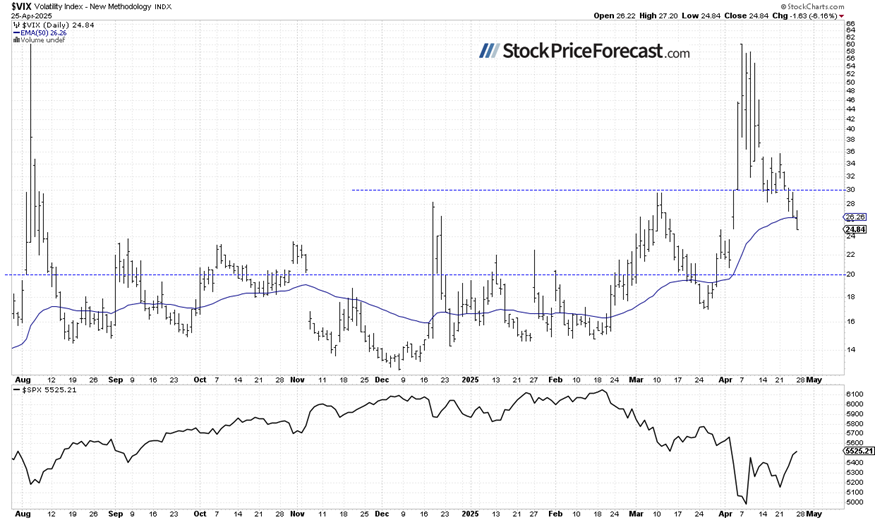
VIX settling lower
The decline in volatility suggests growing investor confidence. On Friday, VIX was as low as 24.84, pulling back from above 30 earlier in the week.
Historically, a dropping VIX indicates less fear in the market, and rising VIX accompanies stock market downturns. However, the lower the VIX, the higher the probability of the market’s downward reversal. Conversely, the higher the VIX, the higher the probability of the market’s upward reversal.
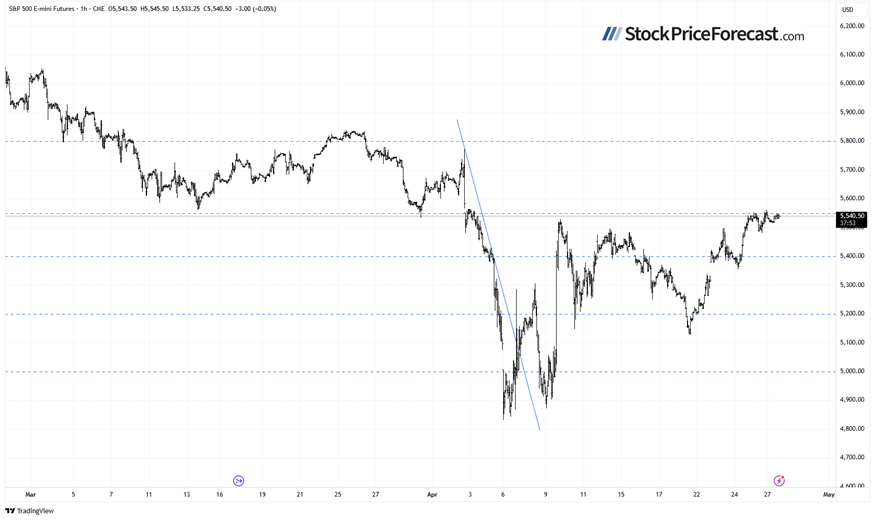
S&P 500 futures contract: Hovering below 5,550
This morning, the S&P 500 futures contract is trading slightly below Friday's close. This represents a modest pullback after last week's strong performance.
The market keeps fluctuating along its previous local high of around 5,530. A breakout higher could push it towards 5,700-5,800 area.
Conclusion
The S&P 500 reached its highest level since early April on Friday, showing continued upward momentum. However, today's expected slightly lower open suggests some consolidation is likely following last week's strong 4.59% rally.
The market continues to advance on several positive catalysts, including easing tariff fears, potential peace developments in Ukraine, and anticipated quarterly earnings releases (major earnings reports this week include Visa, Microsoft, Meta, Amazon, and Apple). That said, it remains uncertain whether this is a new uptrend or merely a correction within the downtrend.
Here’s the breakdown:
-
S&P 500 gained 0.74% on Friday, reaching its highest level since early April.
-
Last week, the index gained 4.59%, retracing more of its early April sell-off.
-
It remains a news-driven market, with tariff developments in focus; mixed signals on U.S.-China trade negotiations continue to influence market sentiment.
Want free follow-ups to the above article and details not available to 99%+ investors? Sign up to our free newsletter today!
Want free follow-ups to the above article and details not available to 99%+ investors? Sign up to our free newsletter today!
Author

Paul Rejczak
Sunshine Profits
Paul Rejczak is a stock market strategist who has been known for the quality of his technical and fundamental analysis since the late nineties.


