Stocks: Tariff storm – Potential bottom forming?

Will today's expected volatility lead to a market bottom or further decline?
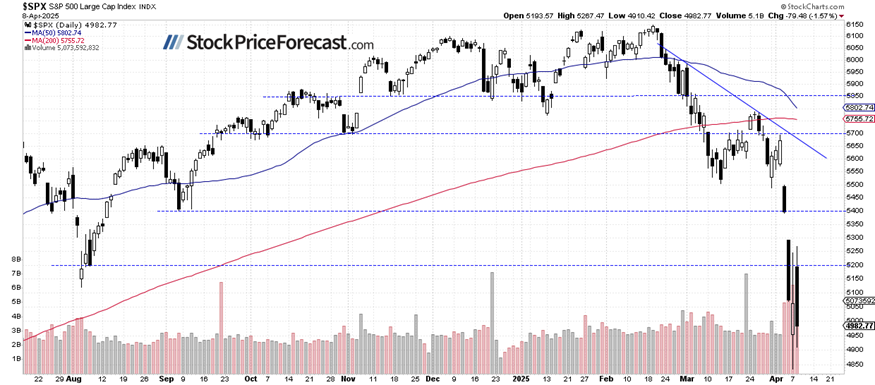
The S&P 500 lost 1.57% on Tuesday, marking its first close below the 5,000 level in nearly a year. After initially rallying, stocks sold off, surprising investors negatively. Today, the S&P 500 index is expected to open 1.7% lower, though it may rebound during the day amid continued volatility.
China announced earlier today that it will impose 84% tariffs on U.S. goods starting Thursday, up from the previously announced 34%. This follows U.S. President Donald Trump's introduction of a 50% hike on Chinese imports, resulting in a 104% cumulative tariff on Chinese goods.
Investor sentiment has significantly worsened, as shown in last Wednesday’s AAII Investor Sentiment Survey, which reported that 21.8% of individual investors are bullish, while 61.9% of them are bearish.
The S&P 500 extends its wild swings following the tariff-induced sell-off, as we can see on the daily chart.
Nasdaq 100 facing severe pressure
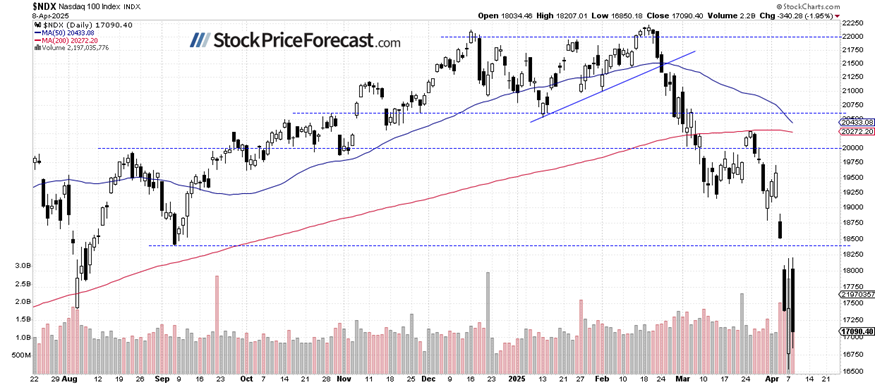
The tech-heavy Nasdaq 100 closed 1.95% lower yesterday, reversing sharply from its initial rally to a local high of around 18,200. It lost over 1,300 points from that high - a direct reaction to escalating tariff news.
Technical supports have been violated across multiple timeframes. However, the market may be forming a bottom before a potential rebound, though this would likely mean a correction rather than the start of a new bull market.
VIX – Highest close since covid
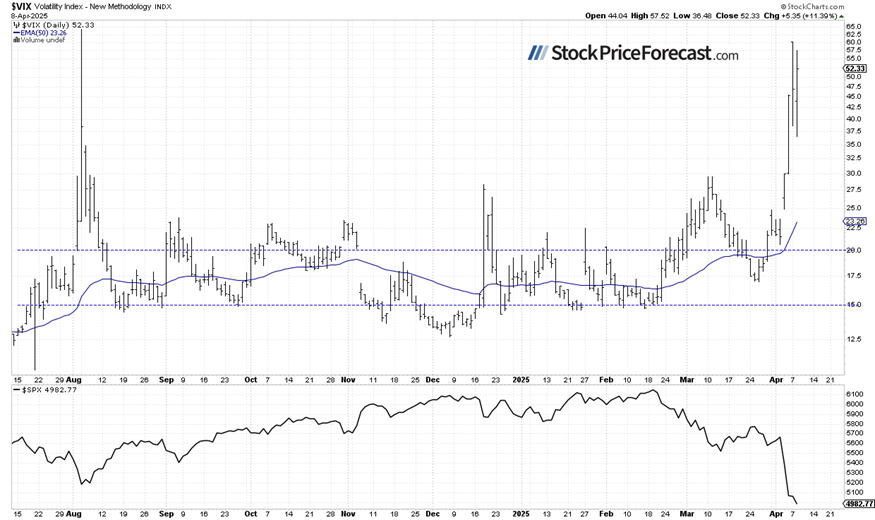
The VIX index has surged amid the market turmoil, reflecting extreme fear among investors. Yesterday, it closed above 50 - the highest level since the COVID-19 crisis.
Historically, a dropping VIX indicates less fear in the market, and rising VIX accompanies stock market downturns. However, the lower the VIX, the higher the probability of the market’s downward reversal. Conversely, the higher the VIX, the higher the probability of the market’s upward reversal.
S&P 500 futures contract returns to recent lows
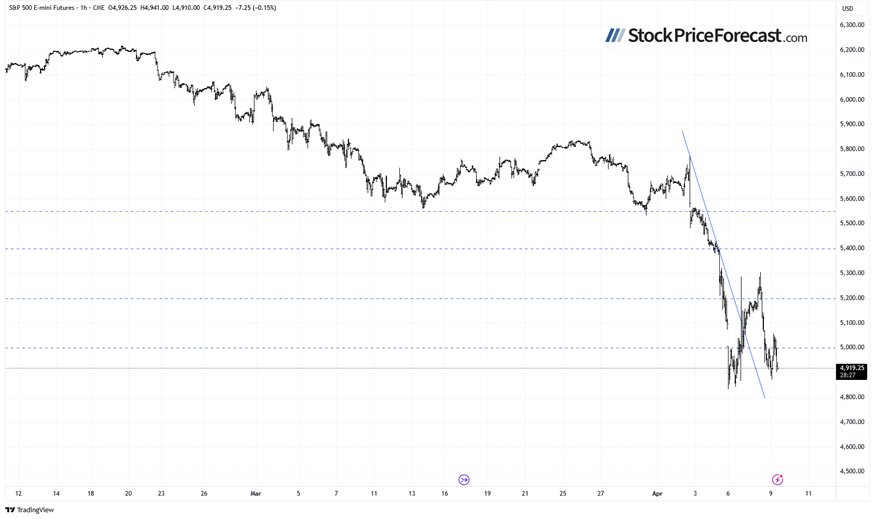
This morning, the S&P 500 futures contract is signaling another decline following China's announcement of retaliatory tariffs. Key support is around 4,830-4,850, marked by recent lows. Resistance is at 5,000-5,050.
The contract may be forming a double-bottom pattern, though it's too early to confirm.
Conclusion
The stock market continues to experience extreme volatility as trade tensions escalate between the world's largest economies. Key support levels have been violated across all major indices, confirming technical damage that will take time to repair.
Here’s the breakdown:
-
S&P 500 futures contract indicates another decline at the open.
-
Retaliatory tariffs from China have intensified global trade concerns.
-
The market may be forming a bottom, but any rebound would likely be a correction rather than a new bull trend.
-
In my opinion, the short-term outlook is neutral.
Want free follow-ups to the above article and details not available to 99%+ investors? Sign up to our free newsletter today!
Want free follow-ups to the above article and details not available to 99%+ investors? Sign up to our free newsletter today!
Author

Paul Rejczak
Sunshine Profits
Paul Rejczak is a stock market strategist who has been known for the quality of his technical and fundamental analysis since the late nineties.


