Stocks sold off: What’s next?

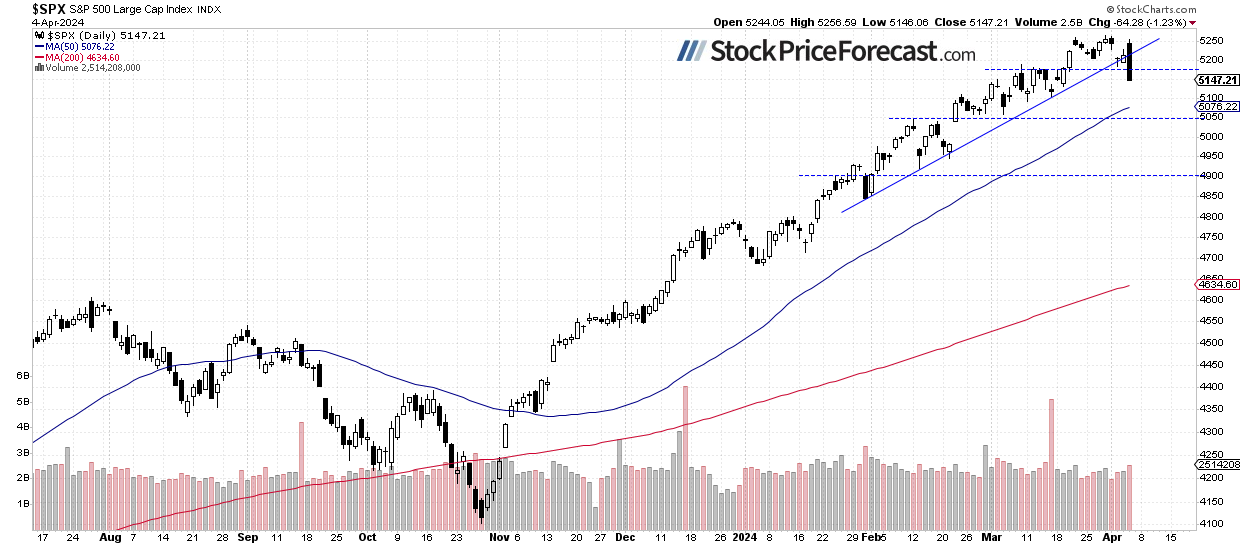
Stocks sold off on Thursday, with the S&P 500 index closing 1.23% lower. The intraday decline was quite significant, as the market opened 0.6% above Wednesday’s closing price. The sentiment reversed after comments from FOMC Member Kashkari indicated less likelihood of interest rate cuts.
Yesterday’s daily low was at 5,146.06, which means that the index retraced around 119 points or 2.25% from last Friday’s new record high of 5,264.85. For now, it looks like a correction within an uptrend; however, the market has gone back to its early March consolidation.
On Tuesday, in my Stock Price Forecast for April, I noted, “Closing the month of March with a gain of 3.1%, the question arises: Will the S&P 500 further extend the bull market in April, or is a downward correction on the horizon? From a contrarian standpoint, such a correction seems likely, but the overall trend remains bullish.”
The investor sentiment has slightly worsened before yesterday’s sell-off, as indicated by this Wednesday’s AAII Investor Sentiment Survey, which showed that 47.3% of individual investors are bullish, while only 22.2% of them are bearish. The AAII sentiment is a contrary indicator in the sense that highly bullish readings may suggest excessive complacency and a lack of fear in the market. Conversely, bearish readings are favorable for market upturns.
This morning, the S&P 500 is likely to open 0.3% higher, as indicated by the futures contract. The sentiment remained slightly positive following the release of important monthly jobs data. Nonfarm Payrolls exceeded expectations at +303,000, much higher than the anticipated +212,000, while the Unemployment Rate declined to 3.8%, vs. expected 3.9%. As a result, the market is poised to rebound at the open, but it is still far from retracing yesterday’s decline. Yesterday, it broke its two-month-long upward trend line, as we can see on the daily chart.
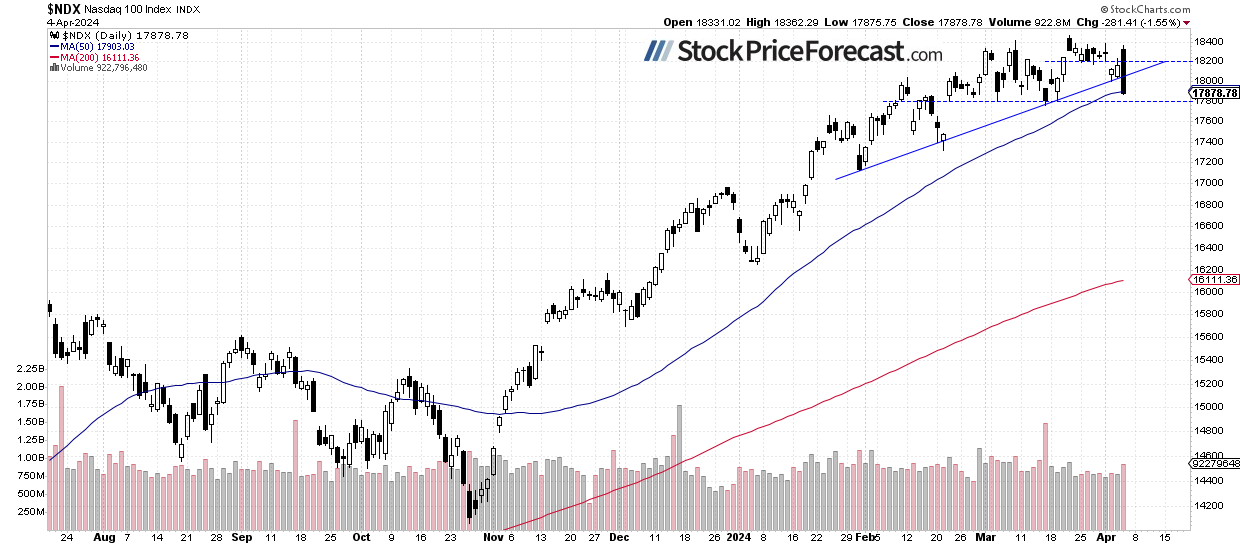
Nasdaq 100 broke below 18,000
Yesterday, the technology-focused Nasdaq 100 index rebounded close to its March 21 record high of 18,464.70, but later in the day, it sold off by almost 500 points, closing below the 18,000 level (-1.55%). It also broke below the upward trend line, but overall, it remained within a two-month-long consolidation.
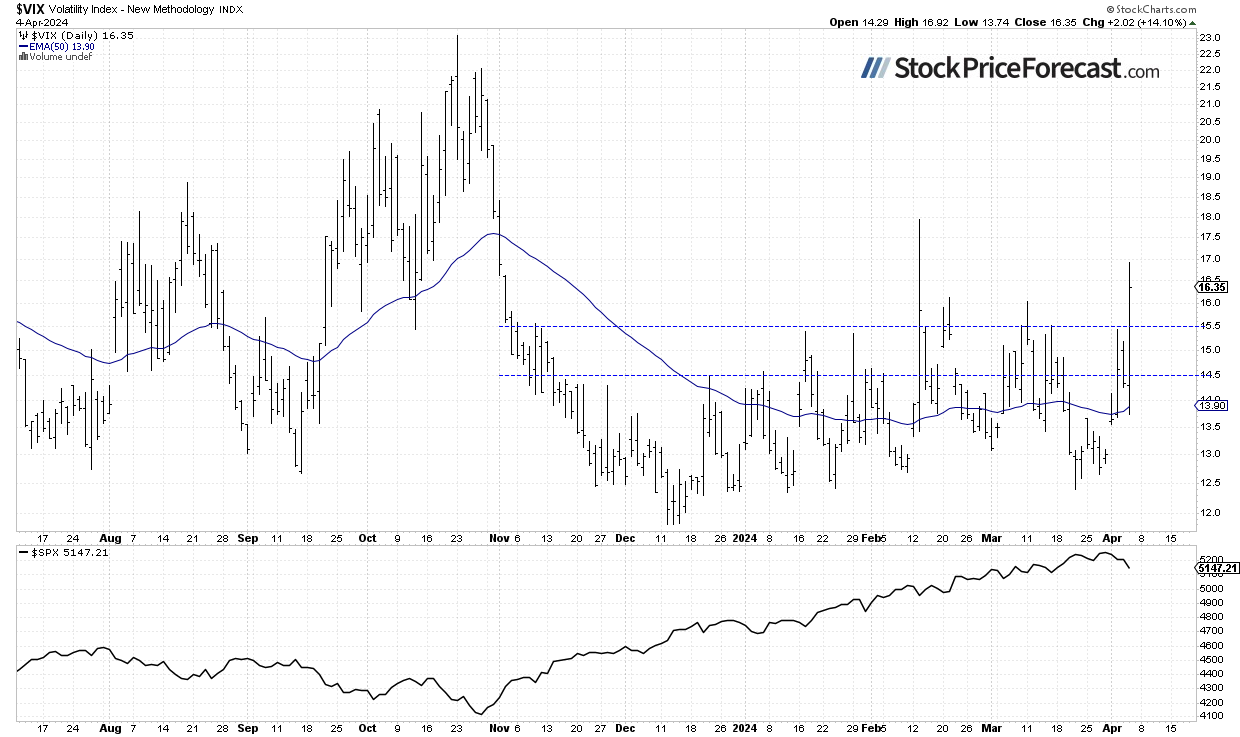
VIX above 16
The VIX index, also known as the fear gauge, is derived from option prices. Last week, it has been trading along the 13 level, and yesterday, it rebounded to around 17 in reaction to a rapid sell-off in stocks.
Historically, a dropping VIX indicates less fear in the market, and rising VIX accompanies stock market downturns. However, the lower the VIX, the higher the probability of the market’s downward reversal.
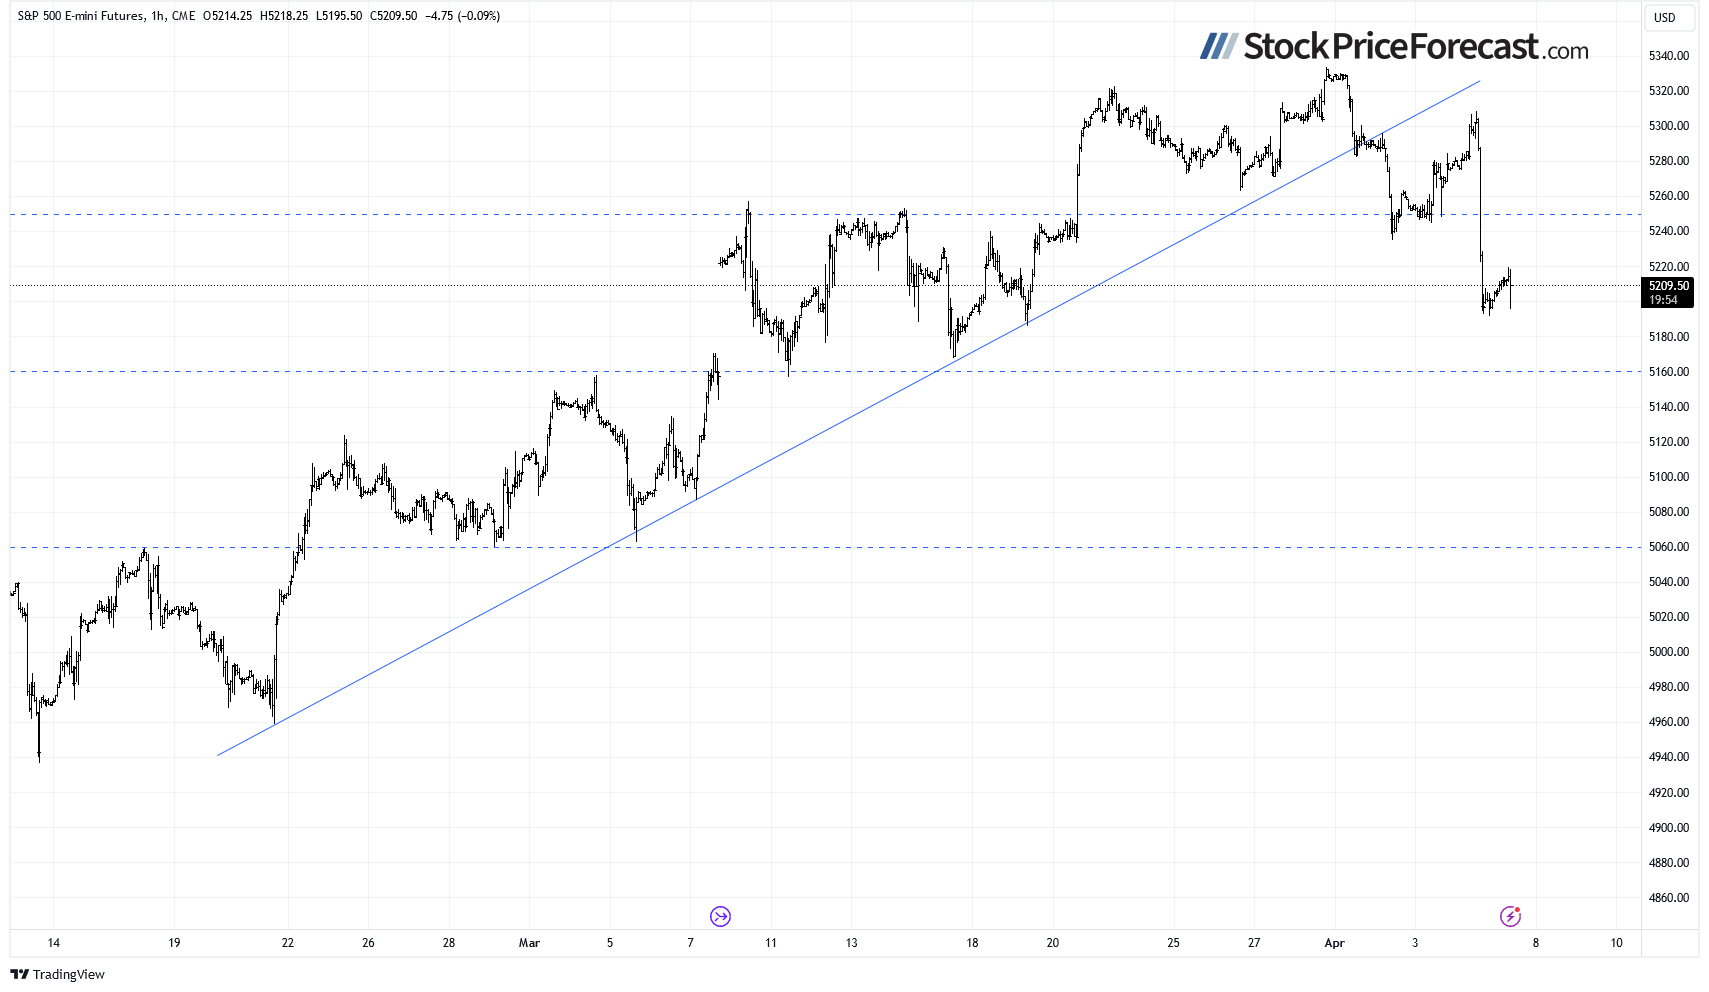
Futures contract – Closer to 5,200
Let’s take a look at the hourly chart of the S&P 500 futures contract. Yesterday, it sold off to around 5,200, and since then, it has been going sideways. The monthly jobs data didn’t change much, and this morning, the contract is trading above the 5,200 level. The support level remains at 5,190-5,200, among others.
Conclusion
The market sold off yesterday, and today, it is likely to retrace some of the decline following a better-than-expected monthly jobs report. However, Thursday’s decline brought a lot of uncertainty and some more pronounced profit-taking action may be in cards at some point.
On Tuesday, I wrote that “In April, we will see a usual series of important economic data, but with the Fed leaning towards easing monetary policy, we should perhaps pay more attention to the quarterly earnings season. However, good earnings may be met with a profit-taking action this time. The market appears to be getting closer to a correction.”
Yesterday, I added: “It appears that profit-taking is happening. Is this a new downtrend? Likely not, however, a correction towards 5,000-5,100 is possible at some point.”
For now, my short-term outlook remains neutral.
Here’s the breakdown:
-
The S&P 500 reversed its recent gains yesterday.
-
In the medium term, stock prices remain somewhat overbought, suggesting the potential for a correction.
-
In my opinion, the short-term outlook is neutral.
Want free follow-ups to the above article and details not available to 99%+ investors? Sign up to our free newsletter today!
Want free follow-ups to the above article and details not available to 99%+ investors? Sign up to our free newsletter today!
Author

Paul Rejczak
Sunshine Profits
Paul Rejczak is a stock market strategist who has been known for the quality of his technical and fundamental analysis since the late nineties.


